Point of Sale Software

Here are some Articles from the Blog Subject - Register Reports -

How Do I Customize My Favorite POS Software Reports?

POS SOFTWARE

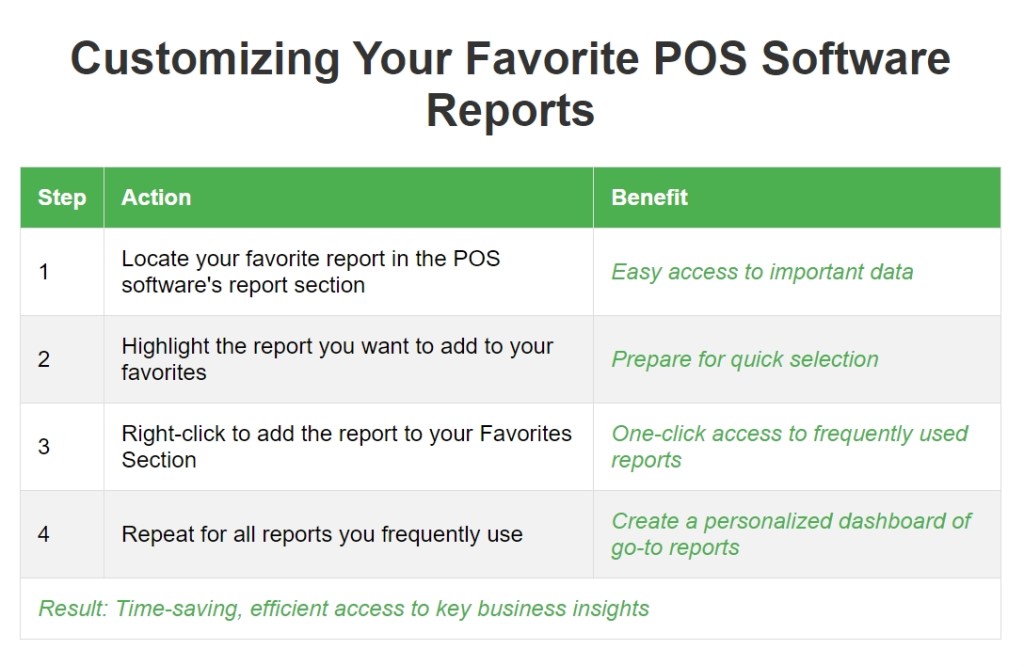
Having your favourite reports in one convenient spot makes using your POS system much easier—you won't have to hunt around for them.

The Power of Personalisation

The ability to customise reports into a favourite area is a game-changer.

Why Customisation Matters

-Time-saving: No more sifting through menus to find the report you commonly use.

-Efficiency: It is much faster as you have them all in one spot.

Creating Your Smart List of Favourite Reports

Now, let's set up your personalised report dashboard. Trust me, it's simple.

Step-by-Step Guide

Creating Your Smart List of Favourite Reports


You've created a dashboard of your go-to reports in one convenient place.

The Beauty of the Favourites Section

Picture this:

-It's Monday morning.

-You've just walked into your shop.

-You want to check last week's sales figures.

Instead of clicking through multiple screens, you open your POS software, and there it is - your Weekly Sales Report in your favourites Section. It's that simple!

The beauty of this is that it grows and adjusts with you. Your favourite dashboard can change as you learn more and want different things. You're not just saving time; you're creating a tool that gives instant insights into your business performance.

Common ones that people put in there frequently are:

-Debtor trial balance

-Quick retail sales comparison

Conclusion: Your Business, Your Reports

Make sure your POS software is as you want it to be. Setting up your Favourites Section only takes a few minutes.

FAQ

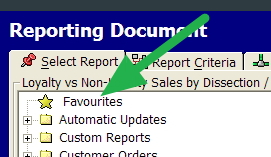
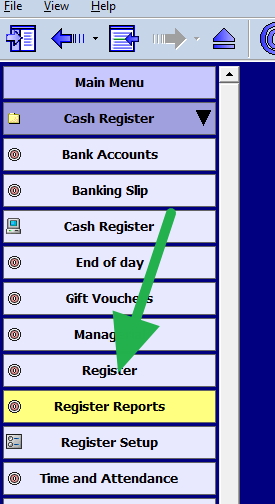
Q: Where do I find my Favourites folder?

A: See here at the green arrow.

Point of Sale Software favourite reports


Q: How do I add favourites to the toolbar?

A: Highlight the report you want to favourite and then right-click.


Graph your sales results

POS SOFTWARE

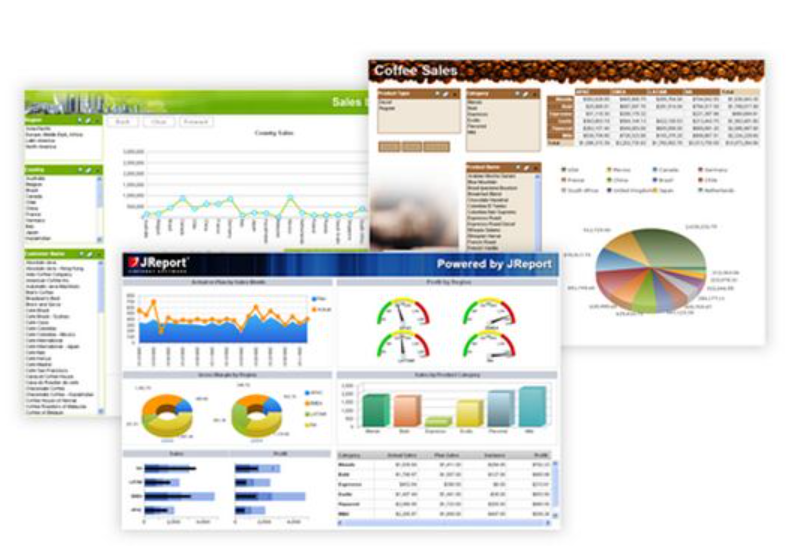
One key to success in retail is monitoring sales trends. Imagine having a report for your business review that you can understand. This is where sales data visualization comes in.

The Power of Sales Data Visualization

As the Russian writer Ivan Turgenev wisely noted, "The drawing shows me at one glance what might be spread over ten pages in a book." This couldn't be truer when analysing your business's sales data.

Graphs offer a quick, clear snapshot of your sales trends. They help you:

  • Spot ups and downs at a glance
  • Identify long-term patterns
  • Assess the impact of your business strategies

Let's dive into how you can easily create and interpret these visual goldmines using a business POS system.

Benefits of Visualising Your Sales Data

  1. Decision-Making: You can quickly identify which products are your top performers.
  2. Inventory Management: It helps you to anticipate seasonal trends and stock accordingly.
  3. Better Sales Efficiency: It enables you to focus on what's working.
  4. Time-Saving: Get retail data insights in seconds instead of hours spent poring spreadsheets.

Creating Your Sales Graph: A Step-by-Step Guide

Step 1: Access Your Reports

  1. Go to Reports in your point of sale software
  2. Select Sales
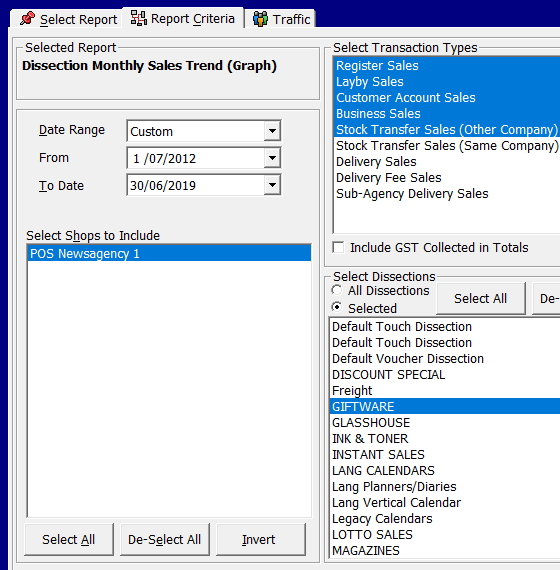
  3. Choose Dissection Monthly Sales Trend (Graph)

Step 2: Set Your Parameters

To get a comprehensive view:

  1. Select an extended timeframe (Do not be afraid to use five years as even this can show much)
  2. Choose your product category (e.g., giftware)


There are many options here, but I will keep it quick and straightforward, and you can build up from there.

Pick a long time; I will pick seven years because I am looking at a long-term trend.

I decided to look at giftware products, so I picked selected and highlighted giftware.


What Can We Learn?

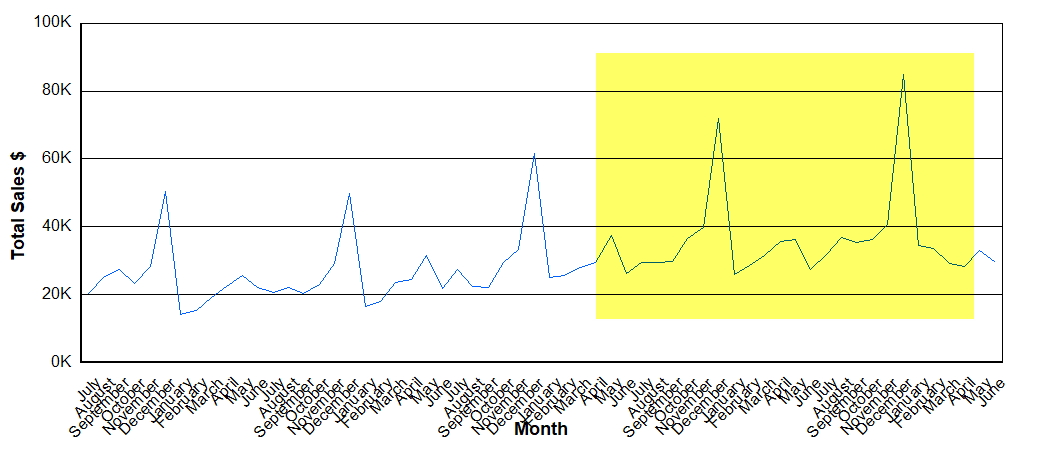
  1. Long-term growth: Sales have increased from $20K-$50K to $30K-$80K monthly.
  2. Seasonal patterns: Christmas peaks are noticeably higher in recent years.
  3. Overall trend: The upward trajectory suggests successful strategies are in place.

I am sure you will agree that it is much easier to see that than a report with lots of numbers.

The Power of Visual Data

Imagine trying to spot these trends in a report full of numbers. With a graph, these insights jump out at you, saving time and mental energy.

Tips and Tricks for Effective Graph Analysis

  1. Compare Year-on-Year: Overlay graphs from different years to spot seasonal patterns and growth.
  2. Zoom In and Out: Look at long-term trends and short-term fluctuations for a complete picture.
  3. Combine Categories: Look at group-related products to identify broader trends in your business.

Your Turn: Give It a Go!

Now that you've seen how easy and insightful graphing your sales can be, why not try it yourself? Here's a quick challenge:

  1. Graph your top-selling product category for the past year
  2. Look for any surprising trends or patterns
  3. Jot down three insights you've gained

Conclusion

Graphing your sales results is a powerful tool for understanding your business travel. By regularly doing these graphs, you'll be better equipped to make informed decisions and improve sales performance.

Ready to Transform Your Sales Analysis?

Try our point-of-sale software now and see how easy it can work for you and turn your sales data for success.

In the world of retail today, knowledge is power. With our POS system for businesses, you have that power.


How did you go with creating your first sales graph? We'd love to hear about your experience and any insights you uncovered. Comment below or contact our support team if you need help getting started.


Add new comment

Restricted HTML

  • Allowed HTML tags: <a href hreflang> <em> <strong> <cite> <blockquote cite> <code> <ul type> <ol start type> <li> <dl> <dt> <dd> <h2 id> <h3 id> <h4 id> <h5 id> <h6 id>
  • Lines and paragraphs break automatically.
  • Web page addresses and email addresses turn into links automatically.
CAPTCHA This question is for testing whether or not you are a human visitor and to prevent automated spam submissions. Image CAPTCHA
Enter the characters shown in the image.

Using data analysis: See how your father's day sales went.

POS SOFTWARE


Retail data analysis analyses everything in your business, from sales to stock to your customer data. The AI now makes it better. It is often used to track customer behaviour and traffic, but it can do more for you.

It is not only applicable to large retailers. SMB retailers, like you, can use information collected from your POS systems. Then the significant advantage that you have is that you can move quickly and so react faster.

Retail analytics example

We are using Father's Day as an example so let see how it went for you with this quick and easy method. It will take you less than a minute to do!

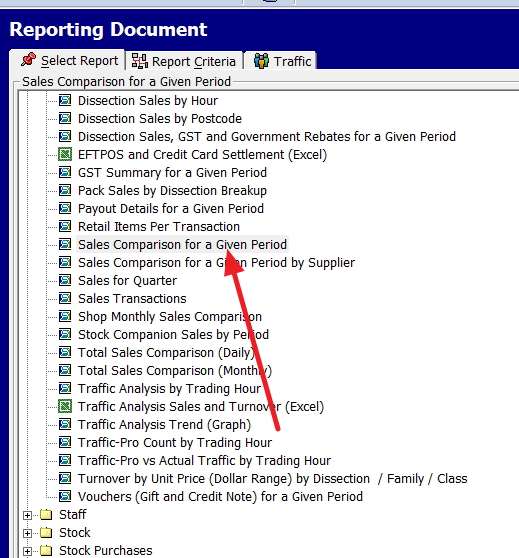
Go to Register reports

Now select Sales register > Sales comparison


As a first and quick example enter in this:  


Retail analysis report

You will get a very detailed report of what happened on that day for you to review.

Retail data analysis provides the information you need to make informed decisions. This will increase your revenue and profitability.

Note: What does appear to have sold well this Father's Day was decorated Coffee mugs and Whiskey tumblers.

Add new comment

Restricted HTML

  • Allowed HTML tags: <a href hreflang> <em> <strong> <cite> <blockquote cite> <code> <ul type> <ol start type> <li> <dl> <dt> <dd> <h2 id> <h3 id> <h4 id> <h5 id> <h6 id>
  • Lines and paragraphs break automatically.
  • Web page addresses and email addresses turn into links automatically.
CAPTCHA This question is for testing whether or not you are a human visitor and to prevent automated spam submissions. Image CAPTCHA
Enter the characters shown in the image.

A fast way to find the supplier invoice for an item

POS SOFTWARE

If you have a dispute over an item that involves your supplier, you need to have the invoice number that you received the item.

Sometimes what so often happens here is that you no longer have the in-house barcode to track it down. Assuming you ever had it. 

What can make it often quite tricky to find as many of the item's details you no longer have. I had a client that got from a customer a pair of returned shoes without the box. So, where can they get it? They knew the style and the colour but little else. Well, it was easy to get the invoice number and so the invoice details. It only took a second. 

Go to Reports > Stock Purchases > Purchases by invoice for a Given period

Put in the likely supplier, if possible. Then put in the possible date ranges. Generally, the warranty period from the supplier is fine because if its outside that you are in trouble. 

Now on the top of the report, press the little binoculars on the top. See where the green arrow is pointing above.

Now in the blue arrow region, put what you know of the item. It can be just about anything, e.g. white, and press "Find Next". Keep pressing "Find Next" till you get it. 

Now you have the invoice and its date.

It is also worth examining this whole section fully as you will find a lot of information for searching.

Add new comment

Restricted HTML

  • Allowed HTML tags: <a href hreflang> <em> <strong> <cite> <blockquote cite> <code> <ul type> <ol start type> <li> <dl> <dt> <dd> <h2 id> <h3 id> <h4 id> <h5 id> <h6 id>
  • Lines and paragraphs break automatically.
  • Web page addresses and email addresses turn into links automatically.
CAPTCHA This question is for testing whether or not you are a human visitor and to prevent automated spam submissions. Image CAPTCHA
Enter the characters shown in the image.

See where your shop sales have transformed over time?

POS SOFTWARE


Retail is changing. As such, what people buy from you changed too. The problem here is that our memory is like a camera. What can be in it is what was not what is now. This can cause significant problems. Own here is an excellent report to show you the shift in your sales shop.

Go to Cash register > reports.

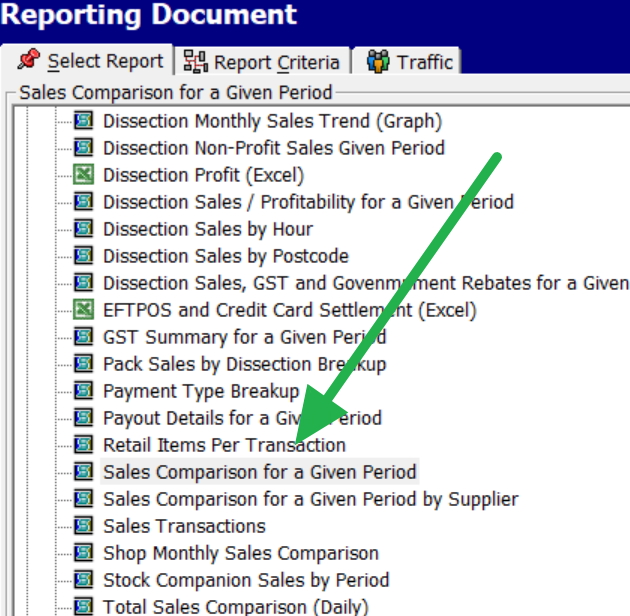
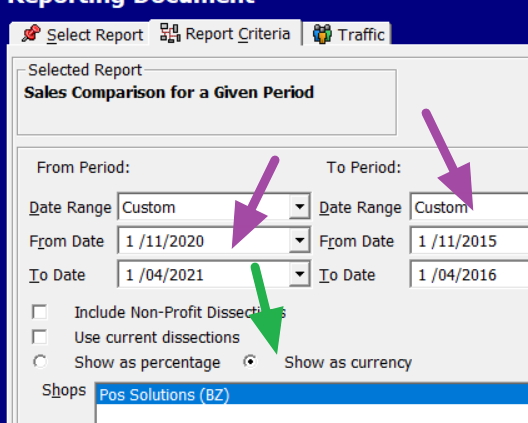
Then Sales -Register> Sales comparison for a given period.

Above in purple, I put in the last few months and notice that I am using a few years back in comparison.

Now also notice in green that I changed the comparison from percentage to currency. This is because what happens is small departments often show dramatic changes. So, for example, a department with $5 in sales then, now having $20 sales, has a big percentage increase. In reality, is not much of a change

Try it.

Put in your figures and see.


Add new comment

Restricted HTML

  • Allowed HTML tags: <a href hreflang> <em> <strong> <cite> <blockquote cite> <code> <ul type> <ol start type> <li> <dl> <dt> <dd> <h2 id> <h3 id> <h4 id> <h5 id> <h6 id>
  • Lines and paragraphs break automatically.
  • Web page addresses and email addresses turn into links automatically.
CAPTCHA This question is for testing whether or not you are a human visitor and to prevent automated spam submissions. Image CAPTCHA
Enter the characters shown in the image.

Get your actual monthly stock sales quantity over the last two years

POS SOFTWARE


Suddenly yesterday, a few people asked me how to get each item's actual stock sales over the last 12 months. 

What they want to see is how many items they moved each month in a department. To do this, you need two years of history. So although we have a report that shows 12 months, I showed them the 24-month sales history report. This is because of what required when looking at sales is to see what you sold last year about this time. For example, Easter is coming up. Say you sell Easter items. With the previous 12 months, you will miss all the sales leading up to Easter for these items. That is why large suppliers often work with figures for the last two years. They then tend to quote you such statistics as this time last year, you sold ...... 

Plus if you are looking at Easter, you may want to look by a selected supplier with these Easter items or a selected range of items marked for Easter. So you rarely need the whole department, as it is too big. 

Well, it is all easy to do and will take you a second to find out.

To get started, go to Register Reports > Sales Stock >  Stock Sales Details 24 Month Trend.

Now put in the criteria you want, and you will see the above report.

You get a lot of detail, the stock on hand figure, two years of history, the total sales, etc.

This report can help you to get helpful insights into the stock that you sell.

Add new comment

Restricted HTML

  • Allowed HTML tags: <a href hreflang> <em> <strong> <cite> <blockquote cite> <code> <ul type> <ol start type> <li> <dl> <dt> <dd> <h2 id> <h3 id> <h4 id> <h5 id> <h6 id>
  • Lines and paragraphs break automatically.
  • Web page addresses and email addresses turn into links automatically.
CAPTCHA This question is for testing whether or not you are a human visitor and to prevent automated spam submissions. Image CAPTCHA
Enter the characters shown in the image.

How to find your top sellers in a category

POS SOFTWARE


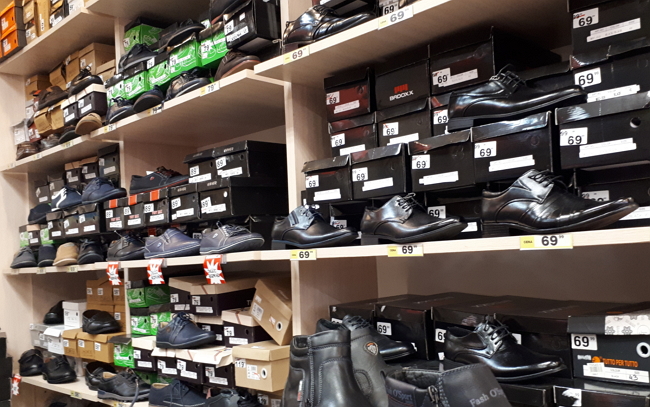
This is a problem faced by our clients that have shoe shops, in our specialised shoe pos software. I cannot see why any retailer cannot use this tip.

The situation is that a huge number of very similar products exist but almost all the sales are in a few lines. This is why most POS systems are useless in shoe shops. They show what we call the granular sales of the department, not the item sales. 

This is where our sales per product reports come in.

These make it easy to identify your best (and worst) selling products. They help you to determine your winners and losers. Suppose a particular product is selling well, its a winner, so you could consider ordering more of it. If the product is not performing, then the early you find out, the better.

This can be useful in any industry, and let me shop you step by step how to find your winners.

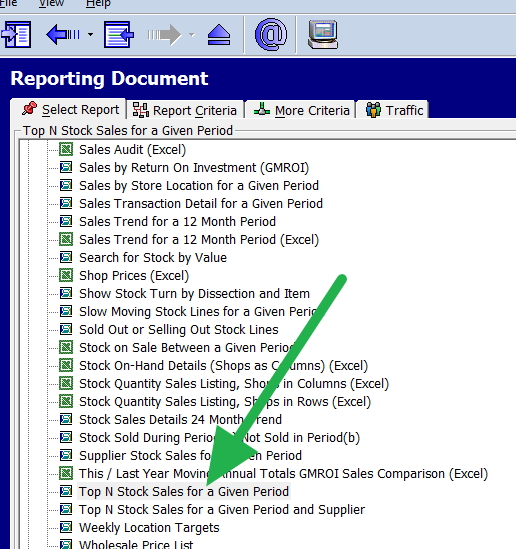
Go to Register reports.


Now pick "Top N Stock Sales for a Given Period."


Now in the form put in the last four weeks, pick a category and outcomes a report with your winners on top.

Now do something!

Add new comment

Restricted HTML

  • Allowed HTML tags: <a href hreflang> <em> <strong> <cite> <blockquote cite> <code> <ul type> <ol start type> <li> <dl> <dt> <dd> <h2 id> <h3 id> <h4 id> <h5 id> <h6 id>
  • Lines and paragraphs break automatically.
  • Web page addresses and email addresses turn into links automatically.
CAPTCHA This question is for testing whether or not you are a human visitor and to prevent automated spam submissions. Image CAPTCHA
Enter the characters shown in the image.

See where the $$ are coming from now?

POS SOFTWARE

Now is an ideal time to see how you are going.

To do this, retailers often measure their performance by the current to last year's figures.  Although many do this by months, working in quarters, here is better. But if you prefer months, work through this example with me now and then once you grasp it, do this analysis by months. 

What this will do is show you how financially COVID hit your business. It will also give you insights into the health of your business. Everyone I have talked to about this has told me that their current financials look weird. 

The report itself is elementary and straightforward to do with our system and will only take you a second to do. 

Go to 

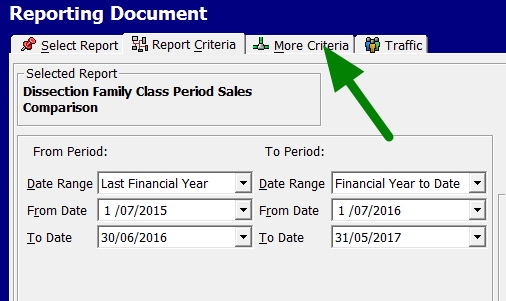
Main Menu > Cash Register > Register Reports > under the Select Report tab, expand the Stock folder > select the report "Dissection Family Class Period Sales Comparison."

Then you will see this screen.

Now put in the left side.

From dates 01/10/2019
To Date 31/12/2019
 

On the right side 

From dates 01/10/2020 
To Date 31/12/2020
Congratulations! You have completed a Q4 analysis.

Now you have much to think about, I am sure.

Add new comment

Restricted HTML

  • Allowed HTML tags: <a href hreflang> <em> <strong> <cite> <blockquote cite> <code> <ul type> <ol start type> <li> <dl> <dt> <dd> <h2 id> <h3 id> <h4 id> <h5 id> <h6 id>
  • Lines and paragraphs break automatically.
  • Web page addresses and email addresses turn into links automatically.
CAPTCHA This question is for testing whether or not you are a human visitor and to prevent automated spam submissions. Image CAPTCHA
Enter the characters shown in the image.

How you can get in real-time your inventory information in seconds

POS SOFTWARE

Here is how by using real-time inventory management. This is so you can get many such benefits, such as having the optimal amount of stock in your shop.

Say a rep is in your shop or on the phone, and you want to discuss your inventory! They have a good overview of their product overall but what they need to know is your shop situation? The odds are that they like you have much to do, so you need to find the answers immediately. 

It would also be best if you showed that you are in control and know what is happening. If a rep thinks they have a person who does not know what is going on, they can use and will use you to dump their unwanted stock. 

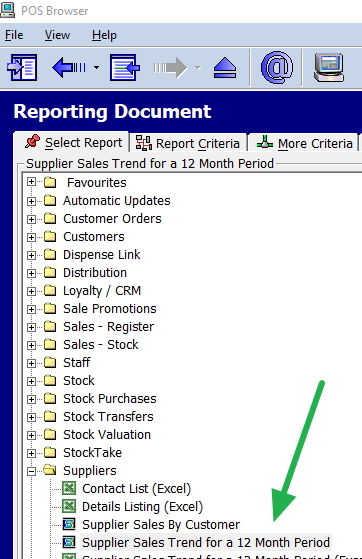
Go to your stock performance report. You will find it here.

Go to register reports>Suppliers>Suppliers sales trend, see the arrow in green


Supplier sales trend menu

Now put in them and set a date a year ago.

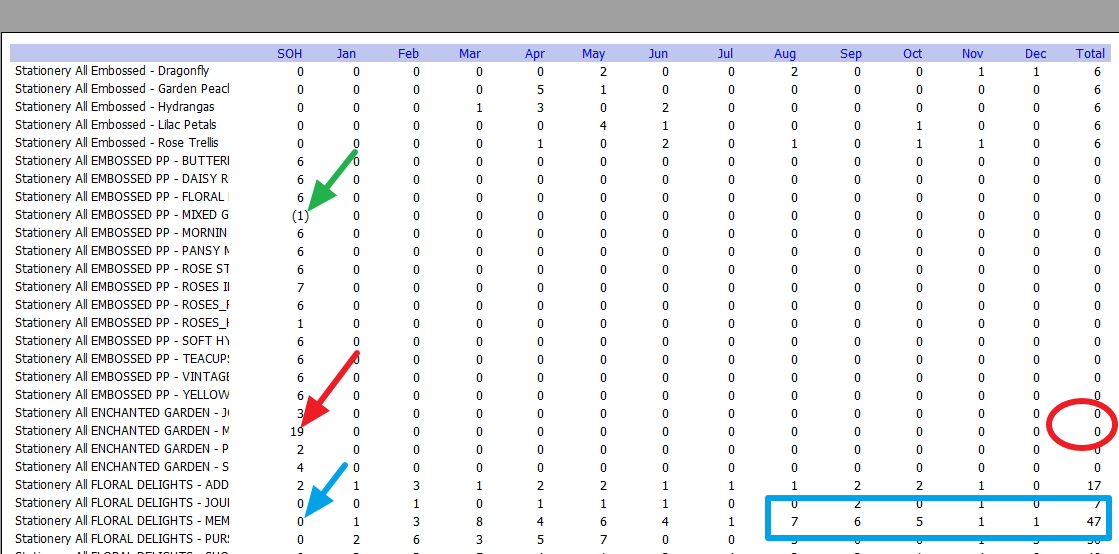
A report like this pops out.

Supplier sales trend report

Let us go through it.

Marked with a green arrow is a negative stock item. This is a sign that your stock quantities are not wholly right.

Look at the arrow in red, you have 19 of this item now, but you never sell any of them. It is a worry. Ask what happened.

Also, as you go down, you will see an item with a blue arrow. You have none in the shop. See how you have no stock, but you have sold heaps of these items.

Where is this going?

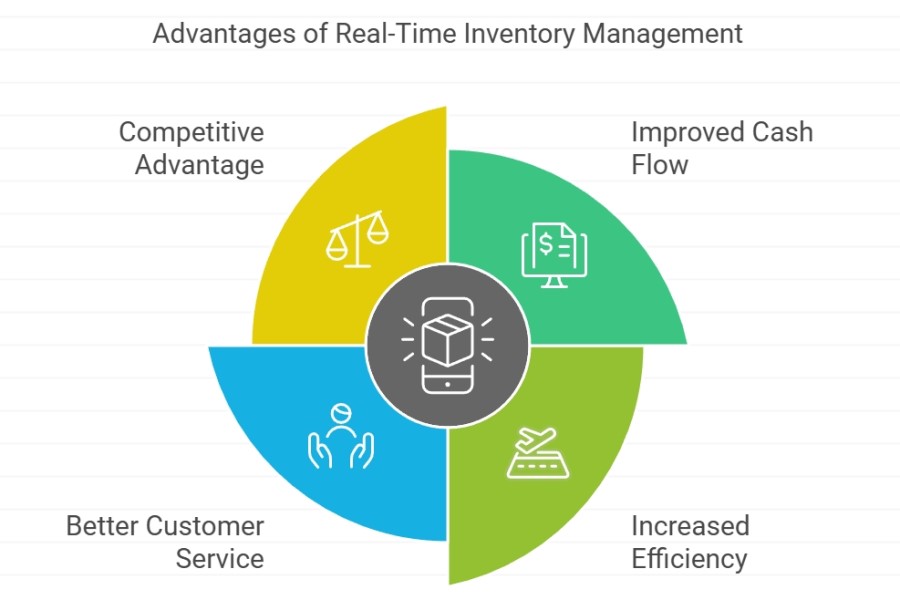
Retailers can get ahead of the competition by using real-time. If they do, it will enhance their efficiency and increase sales.


Add new comment

Restricted HTML

  • Allowed HTML tags: <a href hreflang> <em> <strong> <cite> <blockquote cite> <code> <ul type> <ol start type> <li> <dl> <dt> <dd> <h2 id> <h3 id> <h4 id> <h5 id> <h6 id>
  • Lines and paragraphs break automatically.
  • Web page addresses and email addresses turn into links automatically.
CAPTCHA This question is for testing whether or not you are a human visitor and to prevent automated spam submissions. Image CAPTCHA
Enter the characters shown in the image.

In a second know your best customer

POS SOFTWARE


Find out which of your customers is visiting your shop the most in one second.

Go to register reports> Customers > Top Customers 

Put in say the last two months and Order by Visits and go.

Done

Here are some questions.

Why do these customers appear so often? If you know, you can use this information to get more people to come to your shop.

Identifying your top customers helps you know who to nurture. 

Measuring their value to your business gives you much insight.

If you want to go deeper

You have a lot of options with this report, so there is much more to investigate.

Enjoy

Add new comment

Restricted HTML

  • Allowed HTML tags: <a href hreflang> <em> <strong> <cite> <blockquote cite> <code> <ul type> <ol start type> <li> <dl> <dt> <dd> <h2 id> <h3 id> <h4 id> <h5 id> <h6 id>
  • Lines and paragraphs break automatically.
  • Web page addresses and email addresses turn into links automatically.
CAPTCHA This question is for testing whether or not you are a human visitor and to prevent automated spam submissions. Image CAPTCHA
Enter the characters shown in the image.

What is the best day to collect your business debts

POS SOFTWARE

Most of us have bills and bills and bills.


Recently a company that collects debts from many companies released its findings.  It causes some comments.

The best day from looking at many companies for businesses getting paid was Thursday they claimed. They believe that this is because most people today receive their wages/salary on a Thursday. As they have money on Thursday, they spend it. Although they did not say it, people tend as well to get pensions on Thursday too. But it was interesting is that Sunday had the lowest clearance rate. It made sense if you think about it as about then most people would be budgeting for the coming week. 

So I decided to check using many of my clients' data, and what did I find? 

Well, some clients where all over the place. For example here is the result of four years by one of my clients.

Mon 13.3% Tues 16.4% Wed 8.6% Thu 14.2% Fri 10.3% Sat 37.2%

For this business, Saturday was best. I suspect it because they are in a small centre and people are coming to buy on that day the big weekly family shopping. As they are in the area, they come and pay. Why Tuesday was higher than Wednesday, makes sense as there is not much left on Wednesday. 

What it does show is what I have always said that all businesses are different. This is true even those that do the same things, and each needs to treated differently.

But overall the conclusion does seem correct as a rule, the day for people paying is Thursday. Here is my result from benchmarking 10 different clients over a number of years.

Mon 17.4% Tue 13.4% Wed 13.5% Thu 20.9% Fri 12.8% Sat 15.3% Sun 6.8%

 If you want to know what is your best day to get paid, you can work it out by using Ad Hoc reports.

You will find it here.

Register reports>Customers>Transactions (Excel)


So based on this if you are sending people bills, you need to make sure that they get your bills before Thursday. 


Add new comment

Restricted HTML

  • Allowed HTML tags: <a href hreflang> <em> <strong> <cite> <blockquote cite> <code> <ul type> <ol start type> <li> <dl> <dt> <dd> <h2 id> <h3 id> <h4 id> <h5 id> <h6 id>
  • Lines and paragraphs break automatically.
  • Web page addresses and email addresses turn into links automatically.
CAPTCHA This question is for testing whether or not you are a human visitor and to prevent automated spam submissions. Image CAPTCHA
Enter the characters shown in the image.

How to easily see your sales, profit and quantity sold now

POS SOFTWARE

Want to know what is happening now in your shop, in seconds? 

This is a quick and easy way to get the figures.

Go to Register reports.

In the Sales section select 

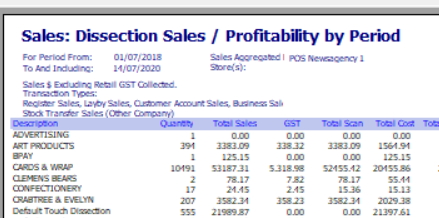
"Dissection Sales/Profitability for a given period" which is here

Fill out the dates you want, and you get a report that looks like this.


With the information you need. It is worthwhile to go through this report in detail as it shows a lot more. For example, how good the barcodes use is in any department, so it can help you to identify problem areas now.


Add new comment

Restricted HTML

  • Allowed HTML tags: <a href hreflang> <em> <strong> <cite> <blockquote cite> <code> <ul type> <ol start type> <li> <dl> <dt> <dd> <h2 id> <h3 id> <h4 id> <h5 id> <h6 id>
  • Lines and paragraphs break automatically.
  • Web page addresses and email addresses turn into links automatically.
CAPTCHA This question is for testing whether or not you are a human visitor and to prevent automated spam submissions. Image CAPTCHA
Enter the characters shown in the image.

Find the busiest periods

POS SOFTWARE

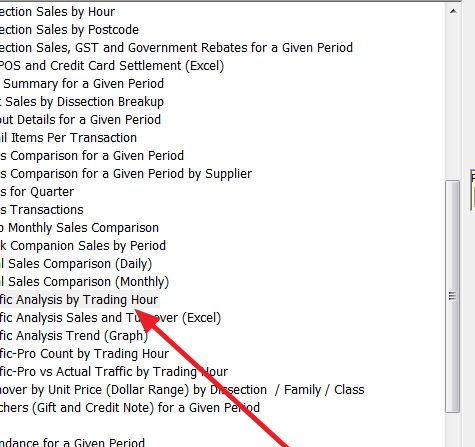
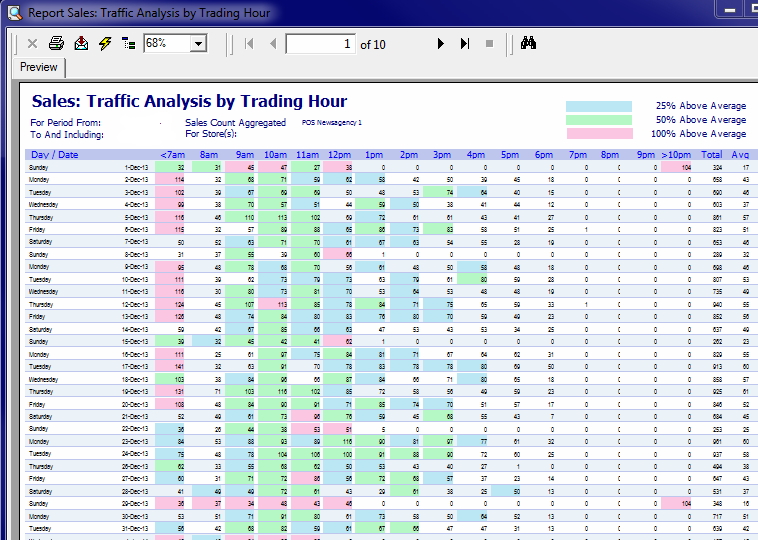
In the shop, traffic often fluctuates from all the time by using your POS Software you can get figures for which periods are the busiest and slowest now.

Go to the register > reports.


I suggest that you run this program twice, the first time for the last few weeks and the second time from a previous year that match the dates you are looking for at for this year. You are going here, to get a very detailed report. The part for this exercise you should look at is the part that gives hourly sales reporting statistics. 

Now the report is colour coded to show extremely busy periods so busy periods are highlighted.

Using this information, you will be able to increase the control of your business better.


Add new comment

Restricted HTML

  • Allowed HTML tags: <a href hreflang> <em> <strong> <cite> <blockquote cite> <code> <ul type> <ol start type> <li> <dl> <dt> <dd> <h2 id> <h3 id> <h4 id> <h5 id> <h6 id>
  • Lines and paragraphs break automatically.
  • Web page addresses and email addresses turn into links automatically.
CAPTCHA This question is for testing whether or not you are a human visitor and to prevent automated spam submissions. Image CAPTCHA
Enter the characters shown in the image.

Evaluating a stock item

POS SOFTWARE

What happens is that when you go to your point of sale software and check your selling report to see how things are selling. You will find items that are selling well but are making little profit. The question often raised here, is even accepting that the item is not making much, is it drawing people into your shop who buy other products?

Well, we can help you somewhat. The reason I say somewhat will be explained here.  

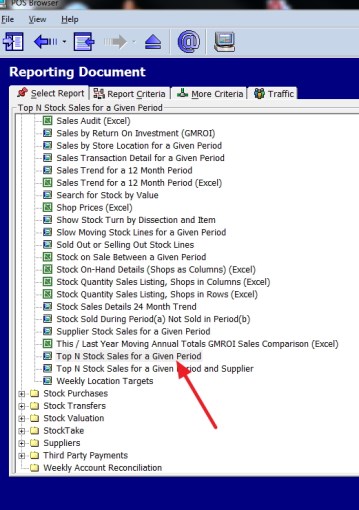
Go to Register reports.


Now select "Top N Stock Sales for a Given Period"


Now put in say a year of sales and ask for the top 100 by quantity. 

Outcomes a report with the top sellers for that year. 

Top sale item by qty

I have not got the heading here, but I will explain. Look at the envelope 

45 is the stock ranking. It is the 45th best selling item in the shop. The 300 is the quantity sold. The next roll is profit, which is $77.45. In comparison, the item on top of it at 44 made the store $1159 profit. Now for many retailers would say to themselves is $77.45 profit enough to justify having this item? Is it enough to even pay the rent, much less the labour and other charges?

Now another issue that most retailers will ask here is, as it does sells well does it bring people into my shop who buy other products? That is very hard to measure, but we can give you an idea.

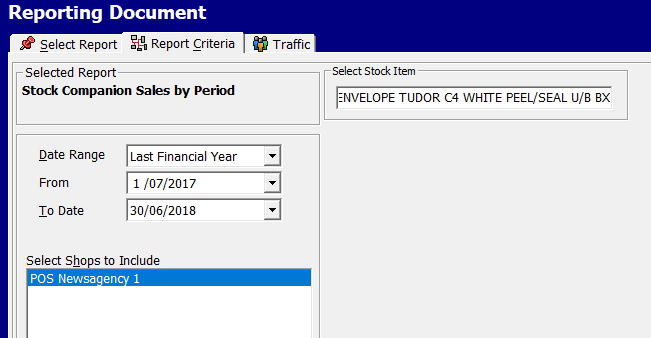
Go to reports > Sales register > Stock Sales companion sales by period 

Now in options put in say last financial year and put in the product ENVELOPE TUDOR....

Stock companion report


Now out pops up a report which will give you a listing of all the items that were sold with this item.

Then at the end will be a total.

Stock companion total

The last number is the profit of $265.01, which is the total profit of all the items sold with this item. 

Now the question is how much of that profit of $265.01 would you have made anyway with or without that profit. That is something you have to decide. 

An analyst like me, as a first-level approximation in the absence of any other information, would probably say

A third would have brought something else in the shop to replace the envelope 

A third would have left and gone elsewhere

A third would not have brought the envelope but everything else.

So I would say the loss involved in dropping the product is 

2/3 x (the actual product $77.45) + 1/3 x ( companion sale of $265.01) = a loss of about $140.

If you can do a better estimate let me know.


Add new comment

Restricted HTML

  • Allowed HTML tags: <a href hreflang> <em> <strong> <cite> <blockquote cite> <code> <ul type> <ol start type> <li> <dl> <dt> <dd> <h2 id> <h3 id> <h4 id> <h5 id> <h6 id>
  • Lines and paragraphs break automatically.
  • Web page addresses and email addresses turn into links automatically.
CAPTCHA This question is for testing whether or not you are a human visitor and to prevent automated spam submissions. Image CAPTCHA
Enter the characters shown in the image.

Now take a minute to do a check on your stock levels

POS SOFTWARE

It is currently the last chance you have to check your stock levels 

However, running out of stock now can have a dramatic impact on your business.

We have a unique report which is super fast to run and gives you an immediate snapshot of your stock levels.

In Cash register report, call up the GMROI (see the selection highlighted) in your point of sale software in the reports here.
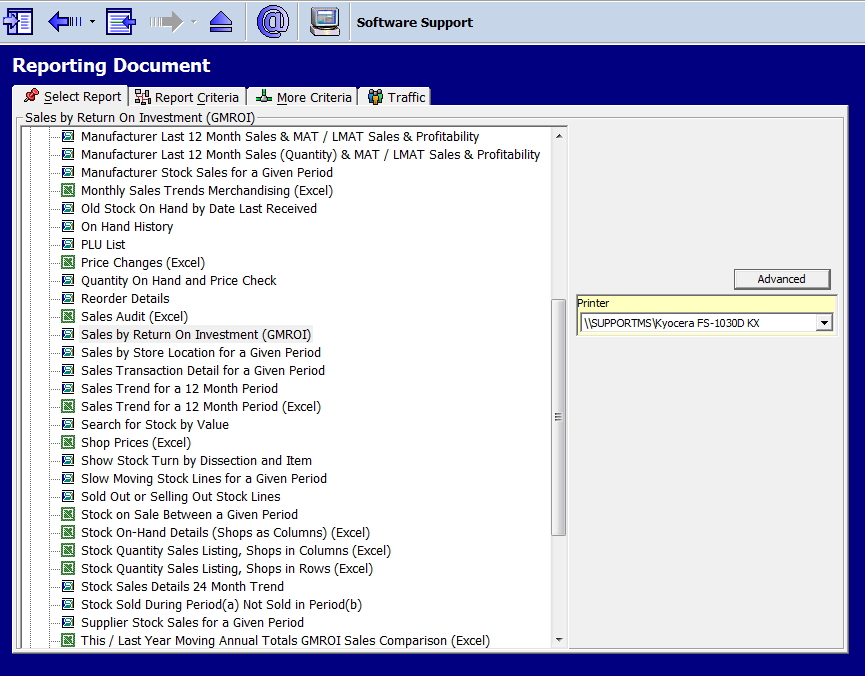
You can select the list of options you want, and I suggest you go over these options later when you have time.

I recommend doing this by departments or supplier, whatever makes more sense for you. 

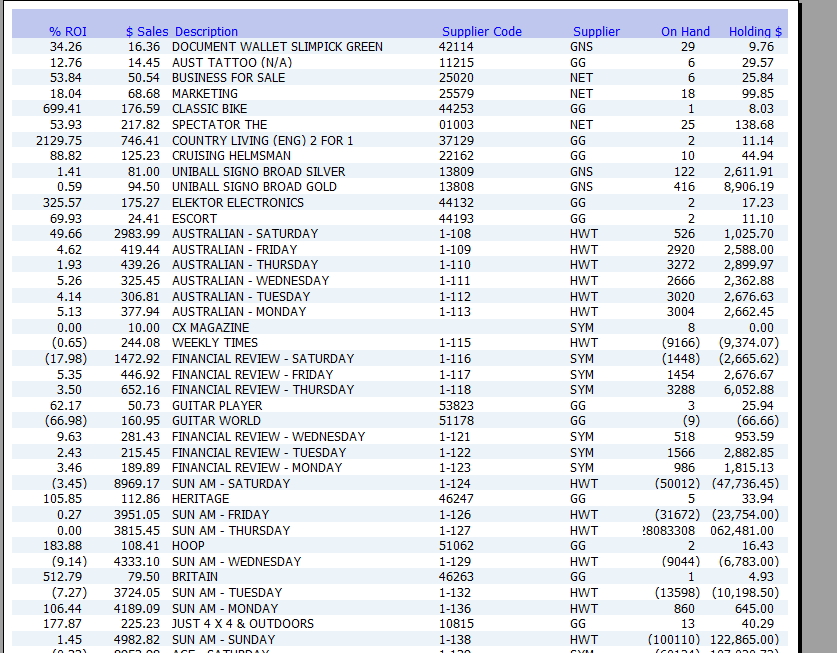
Now you get a report like this.

As you can see the items are all listed.

Let’s look at it in detail:

What we are looking for is items with low stock on hand figures, decent sales, and reasonable ROI% figures, ROI% is the return on investment, it is one of the best ways to determine how valuable your stock items are to your business. It is calculated by the (unit sold) x (Profit)/ (Average stock cost) and you need about 3.2 in industry, but as you can see here, there are many items above and below it.

Now it is up to you

Add new comment

Restricted HTML

  • Allowed HTML tags: <a href hreflang> <em> <strong> <cite> <blockquote cite> <code> <ul type> <ol start type> <li> <dl> <dt> <dd> <h2 id> <h3 id> <h4 id> <h5 id> <h6 id>
  • Lines and paragraphs break automatically.
  • Web page addresses and email addresses turn into links automatically.
CAPTCHA This question is for testing whether or not you are a human visitor and to prevent automated spam submissions. Image CAPTCHA
Enter the characters shown in the image.

All I want for Christmas...

POS SOFTWARE

Currently, 2018 Christmas retails sales are expected to grow 2.9% this year. According to the well-known comparison site, finder.com.au Australians are expecting to spend $1325 each on average on Christmas. “people expect to spend on average $464 each on presents, $444 on travel, $131 on alcohol, $122 on food and $61 on decorations,”

Are you part of it?

Do you have the right stock NOW in your shop? Another important question is do you actually have the stock you think you do? It is easy to forget what you have.

What I do suggest is you look at your mirror marketing reports.

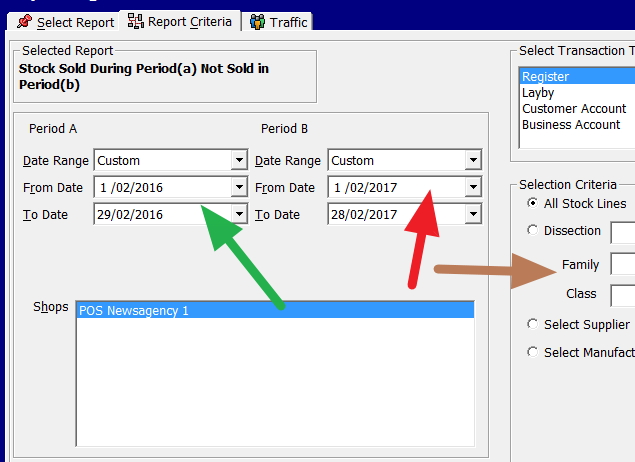
Go to Register Reports marked in green.


Now select in stock, "Stock Sold During Period(a) Not Sold in Period(b)"

What the report will tell you is what was sold in a previous period last year but has not been sold in this period. What you are trying to do is mirror your success last year.


Now in brown, you will see that there is a lot of flexibility for your reports there is also an integrated traffic analysis available too but let's keep it simple for the time being.

Now you will get a report with what you sold over the period, but you are not selling in your current period. What you find is I am sure worth investigating.

After that please redo this report for other years besides last year.

If you find goods missing, you need to hurry as we have less then 20 days left.


Comments

Dear Bernie
I am in Perth and I am trying to find an app that will convert anything into an ddo or dd2 file did you have any success. or are you beating your head on the wall like me. [email protected]

Add new comment

Restricted HTML

  • Allowed HTML tags: <a href hreflang> <em> <strong> <cite> <blockquote cite> <code> <ul type> <ol start type> <li> <dl> <dt> <dd> <h2 id> <h3 id> <h4 id> <h5 id> <h6 id>
  • Lines and paragraphs break automatically.
  • Web page addresses and email addresses turn into links automatically.
CAPTCHA This question is for testing whether or not you are a human visitor and to prevent automated spam submissions. Image CAPTCHA
Enter the characters shown in the image.

Top customers by visits

POS SOFTWARE

In retail getting customers to come more often to the shop is vital.

Questions:

Why do some customers come often and others do not?

Have you thought about this tried to figure out why some come a lot?

If you know, maybe you can use this information to get more people to come to your shop. Well, let us do that!

In your point of sale software and go into register reports>customers

There you will find a report "Top customers"

Image removed.Image removed.

Now click on that report (see the arrow in green)

Image removed.Image removed.

Now put in the dates you are looking at, I suggest at least a year and if you like a minimum spend.

See where the green arrow is highlighting. Change the sort order by visits.

This will give you a report with a grouping of your customers based on how often they buy from you. Now chew over why these people are coming, what are you doing right to get them to come?


Now let’s dig deeper

There are many other orders e.g. a listing by people that buy a lot you can use in this report, all which have their own story too. So there is plenty to chew over here.


Add new comment

Restricted HTML

  • Allowed HTML tags: <a href hreflang> <em> <strong> <cite> <blockquote cite> <code> <ul type> <ol start type> <li> <dl> <dt> <dd> <h2 id> <h3 id> <h4 id> <h5 id> <h6 id>
  • Lines and paragraphs break automatically.
  • Web page addresses and email addresses turn into links automatically.
CAPTCHA This question is for testing whether or not you are a human visitor and to prevent automated spam submissions. Image CAPTCHA
Enter the characters shown in the image.

BUSINESS REPORTS WITH POINT OF SALE SOFTWARE

What point that often I find stunning is the comparison of when I talk to the chiefs in large organisations compared to owners of small businesses (SMB). The leaders know less, much less but what they do know is relevant and essential to the problem at hand. The owner of an SMB, often does not know anything. The owner has all the details in their head, the pixels that they know little of the big picture.

I do not believe that retail business has ever had access to such a wealth of information as they do today.

A conversation might start, what is your top seller? The owner often gives a blank stare, well we sell a lot of this and that what is the top seller, it could be.... Yet the information is available in their POS system here.

Register sales report point of sale

Add new comment

Restricted HTML

  • Allowed HTML tags: <a href hreflang> <em> <strong> <cite> <blockquote cite> <code> <ul type> <ol start type> <li> <dl> <dt> <dd> <h2 id> <h3 id> <h4 id> <h5 id> <h6 id>
  • Lines and paragraphs break automatically.
  • Web page addresses and email addresses turn into links automatically.
CAPTCHA This question is for testing whether or not you are a human visitor and to prevent automated spam submissions. Image CAPTCHA
Enter the characters shown in the image.

EACH STOCK ITEM HAS ITS OWN TREND

If you are seeing that you need to discount a lot to sell stock you are overstocked, it is a sure sign that you need to do something. As a punt what is happening is that you are overordering on some items and probably underordering on others. What often we see in retail is that our memory is by definition the past and the memory remembers old top sellers but what we need is the top sellers today. Here is how to identify what is selling well now to check that you have enough stock for tomorrow and it is very easy in our point of sale system.

Go to Register reports

Register reports POINT OF SALE

Select the "Top N Stock Sales for a Given Period"

Top Stock Items Point of sale


Now out pops the following.


Now select a day, as it is an old database I put in an old date. Usually, you would put in yesterday or today, just make sure you get close to a full day of trading.


Top Stock Items reporting


Now you get a report with the top sellers now


Keep track of top selling items


Add new comment

Restricted HTML

  • Allowed HTML tags: <a href hreflang> <em> <strong> <cite> <blockquote cite> <code> <ul type> <ol start type> <li> <dl> <dt> <dd> <h2 id> <h3 id> <h4 id> <h5 id> <h6 id>
  • Lines and paragraphs break automatically.
  • Web page addresses and email addresses turn into links automatically.
CAPTCHA This question is for testing whether or not you are a human visitor and to prevent automated spam submissions. Image CAPTCHA
Enter the characters shown in the image.