Negative Stock (Inventory): How to Find your Stock Discrepancies Fast
Negative inventory, also known as negative stock, is when your system shows that item quantities are negative. For SMB retailers, this is a warning sign of serious inventory management issues that need immediate attention. Every instance points to deeper problems in your POS system. If not fixed, this negative stock can quickly lead to significant issues.
Understanding the causes of negative stock is a first step toward resolving these discrepancies.
Understanding negative stock
When your records display negative stock, your stock quantities information is unreliable, making it difficult to make informed business decisions. As a result, staff may lose trust in the POS system and hesitate to rely on its information. If the staff start to realise that your controls are weak, it can be disastrous as it invites staff theft.
Additionally, negative inventory distorts sales, purchasing, and financial reports, making it more difficult to analyse performance.
Beyond data reliability, negative inventory also disrupts key business reports.
Causes of Negative Inventory and How to Prevent Them
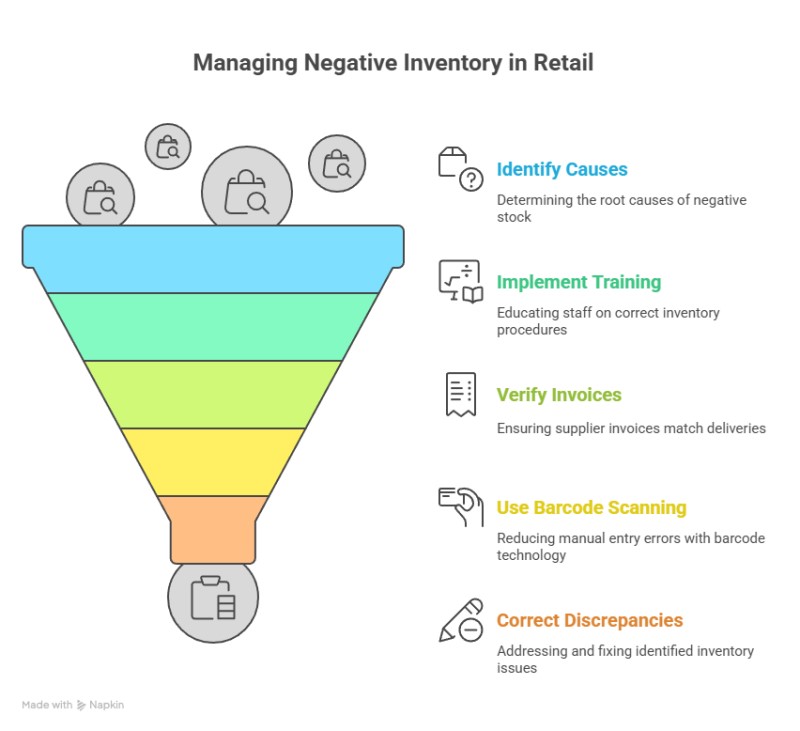
Negative stock usually results from a mix of factors. -Delays in processing supplier invoices (leading to sales before stock is entered into the POS System) -Errors in supplier invoices -Staff entering incorrect quantities.
Fortunately, some preventative measures can help minimise these inventory incidents.
Preventing negative inventory starts with robust staff training. Ensure your team understands correct inventory procedures and that you consider accurate data entry essential. Check carefully that suppliers' electronic invoices match the deliveries. Implementing barcode scanning for both receiving and selling stock significantly reduces manual entry errors.
Improve Barcode Scanning Discipline
Negative inventory often occurs when cashiers bypass barcode scanning and manually key in an item, accidentally selecting the wrong product (SKU). The system depletes the stock of the wrong item,driving it negative, while the item that was actually sold remains overstated in the system. We need to strictly enforce barcode scanning at the register. If necessary, require manager approval for cashiers to manually type in SKUs.
Financial and Customer Service Consequences
Negative stock can have significant financial consequences, as it distorts your KPIs and leads to incorrect calculations of the cost of goods sold (COGS) and profit margins.
Possibly the biggest problem is that it will result in inaccurate GST tax reporting.
From a customer service perspective, negative inventory can lead to lost sales and a poor customer experience, as the computer indicates that you do not have stock when, in fact, you do have the stock the customer is looking for to buy.
Detecting and Correcting Negative Inventory
To address negative inventory, use your POS system to run reports like 'Quantity On Hand' or 'Price Check.' It is easier to do it one department at a time rather than the whole shop at once. Items with negative quantities are clearly shown. Please investigate each case to identify whether the cause is a counting error, data entry mistake, or delayed invoice.
These financial inaccuracies also impact customer service in tangible ways.
Finding the negative stock
Fortunately, we have a quick and easy way to check stock quantities for what you have on hand.
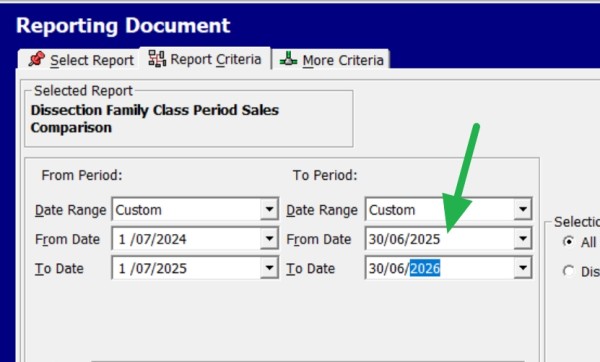
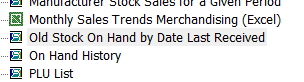
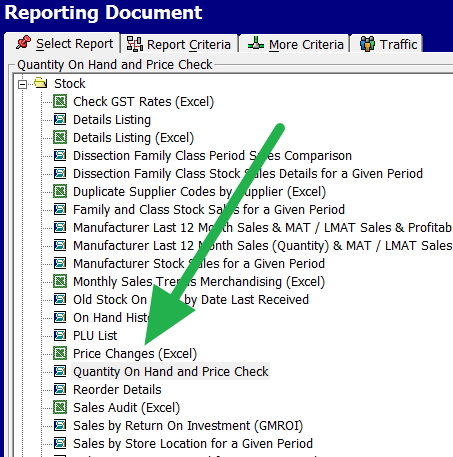
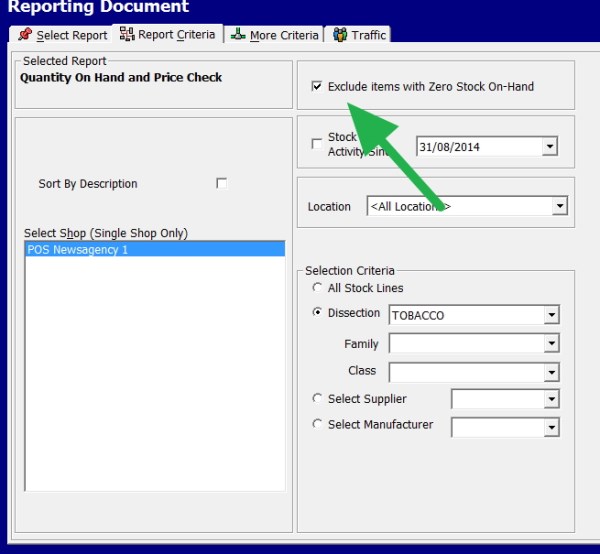
Go to reports. There is an option for Quantity On Hand and Price check; click on that.
We exclude items with zero stock.
I suggest doing it by department, so in this example, I picked the dissection (department) tobacco.
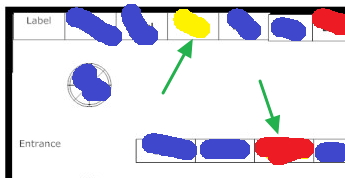
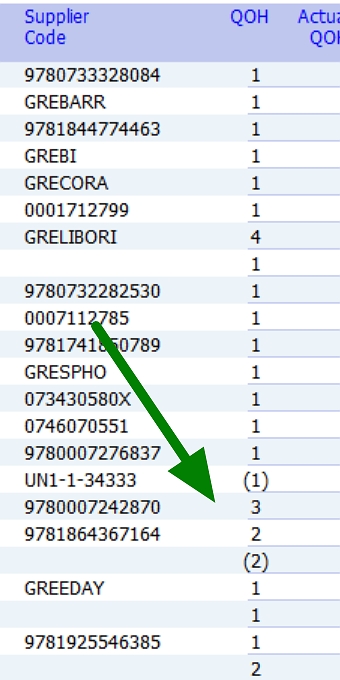
Now, in the outcomes report, which lists the details of your item, look at the quantities on hand in the QOH column. You may see items in brackets, as indicated by the green arrow below; these are the negative Stock Discrepancies.
At first, you will find it a lot of work to fix it, but once done, it's relatively quick.
You should frequently check this report for negative stock values, say monthly until the problem is fixed.
Now, audit these negative items to determine what went wrong in your inventory management system.
Inventory Adjustment Best Practices
After completing a stocktake, your inventory figures are at their most accurate. So it is the ideal time to review and correct any discrepancies.
When making inventory adjustments, it is a good idea to determine the reason for each correction. It can reduce the problem in the future.
Real-World Example: The Cost of Negative Inventory
A staff member mistakenly told a customer that the item was out of stock when it was actually in stock. It led to a lost sale for the business. When the staff member saw they had the jumpers, they reported this to the owner. What she found was a negative quantity for a popular jumper. However, upon investigation, they discovered that they had not entered a recent delivery invoice.
Empowering Your Retail Business
With proactive prevention and early detection, negative inventory can be handled by utilising tools like our reports to stay informed about your stock quantities.
Only by understanding the causes can you fix the problem.
Let us know if you have any other questions!
*This article draws on industry best practices and current expert recommendations to help SMB retailers understand and tackle negative inventory.
I would like to thank mentoring software for their help with this article.
Written by:

Bernard Zimmermann is the founding director of POS Solutions, a leading point-of-sale system company with 45 years of industry experience, now retired and seeking new opportunities. He consults with various organisations, from small businesses to large retailers and government institutions. Bernard is passionate about helping companies optimise their operations through innovative POS technology and enabling seamless customer experiences through effective software solutions.