
One key to success in retail is monitoring sales trends. Imagine having a report for your business review that you can understand. This is where sales data visualization comes in.
The Power of Sales Data Visualization
As the Russian writer Ivan Turgenev wisely noted, "The drawing shows me at one glance what might be spread over ten pages in a book." This couldn't be truer when analysing your business's sales data.
Graphs offer a quick, clear snapshot of your sales trends. They help you:
- Spot ups and downs at a glance
- Identify long-term patterns
- Assess the impact of your business strategies
Let's dive into how you can easily create and interpret these visual goldmines using a business POS system.
Benefits of Visualising Your Sales Data
- Decision-Making: You can quickly identify which products are your top performers.
- Inventory Management: It helps you to anticipate seasonal trends and stock accordingly.
- Better Sales Efficiency: It enables you to focus on what's working.
- Time-Saving: Get retail data insights in seconds instead of hours spent poring spreadsheets.
Creating Your Sales Graph: A Step-by-Step Guide
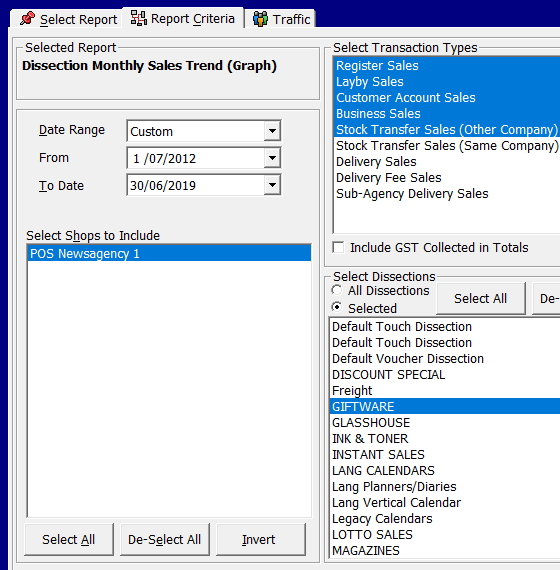
Step 1: Access Your Reports
- Go to Reports in your point of sale software
- Select Sales
- Choose Dissection Monthly Sales Trend (Graph)
Step 2: Set Your Parameters
To get a comprehensive view:
- Select an extended timeframe (Do not be afraid to use five years as even this can show much)
- Choose your product category (e.g., giftware)

There are many options here, but I will keep it quick and straightforward, and you can build up from there.
Pick a long time; I will pick seven years because I am looking at a long-term trend.
I decided to look at giftware products, so I picked selected and highlighted giftware.
What Can We Learn?
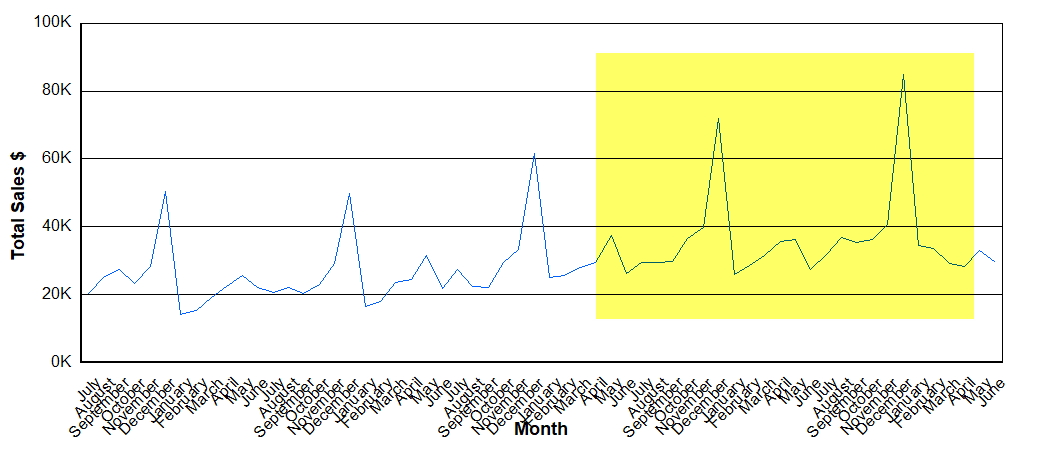
- Long-term growth: Sales have increased from $20K-$50K to $30K-$80K monthly.
- Seasonal patterns: Christmas peaks are noticeably higher in recent years.
- Overall trend: The upward trajectory suggests successful strategies are in place.
I am sure you will agree that it is much easier to see that than a report with lots of numbers.
The Power of Visual Data
Imagine trying to spot these trends in a report full of numbers. With a graph, these insights jump out at you, saving time and mental energy.
Tips and Tricks for Effective Graph Analysis
- Compare Year-on-Year: Overlay graphs from different years to spot seasonal patterns and growth.
- Zoom In and Out: Look at long-term trends and short-term fluctuations for a complete picture.
- Combine Categories: Look at group-related products to identify broader trends in your business.
Your Turn: Give It a Go!
Now that you've seen how easy and insightful graphing your sales can be, why not try it yourself? Here's a quick challenge:
- Graph your top-selling product category for the past year
- Look for any surprising trends or patterns
- Jot down three insights you've gained
Conclusion
Graphing your sales results is a powerful tool for understanding your business travel. By regularly doing these graphs, you'll be better equipped to make informed decisions and improve sales performance.
Ready to Transform Your Sales Analysis?
Try our point-of-sale software now and see how easy it can work for you and turn your sales data for success.
In the world of retail today, knowledge is power. With our POS system for businesses, you have that power.
How did you go with creating your first sales graph? We'd love to hear about your experience and any insights you uncovered. Comment below or contact our support team if you need help getting started.

