Point of Sale Software

Here are some Articles from the Blog Subject - Stock Control -

How to use Gross Margin Return on Inventory (GMROI) in your shop

POS SOFTWARE

As I stated, GRMOI is one of the foundations of modern inventory management today. This is why we have supplied our clients with this powerful tool. 

Hopefully, now, you have been trying out Gross Margin Return on Inventory (GMROI) in your shop. If not, look at my post a few days ago and only then come back to this post.

What GMROI incorporates in one figure, stock turns and profit. It allows you to focus on margins and turnovers.

The significant advantage of GMROI 

1) It is consistent and widely used. Other systems, such as Direct Product Analysis (DDP), need you to make assumptions. They take much longer to work out. Different people using it come out with other figures. So their analysis will give various figures depending on who runs the report.  I will show you DDP in our software in another post soon because it is also excellent. 

With GMROI, everyone is looking at the same figure.

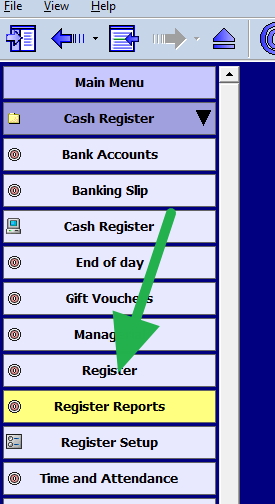
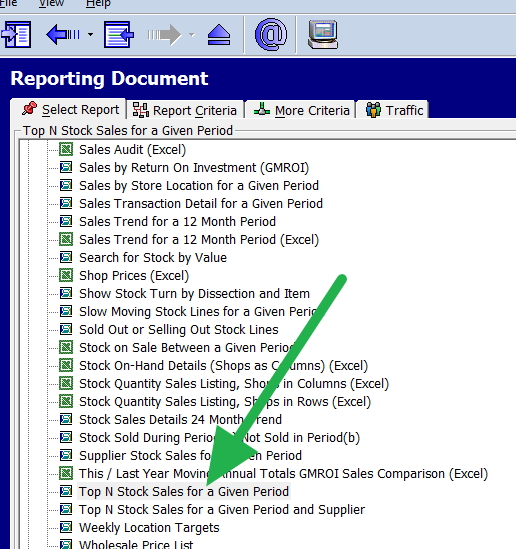
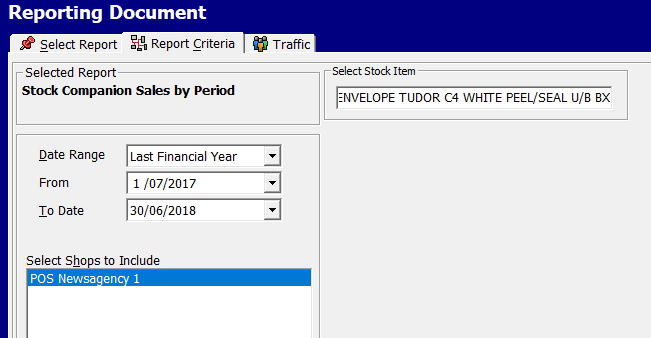
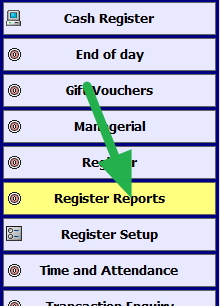
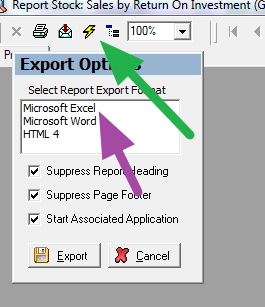
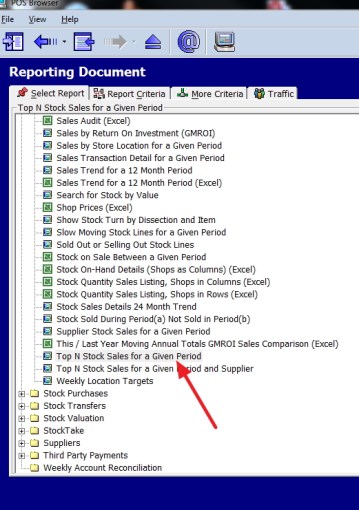
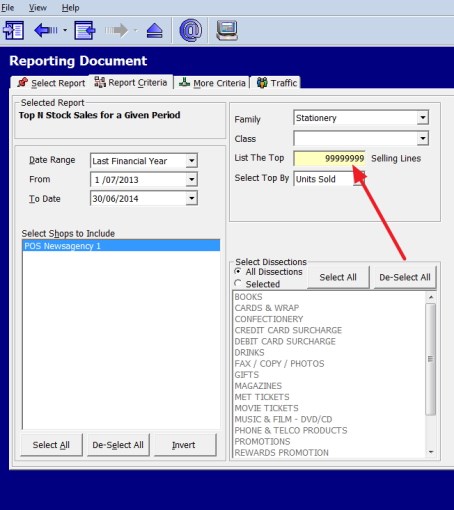
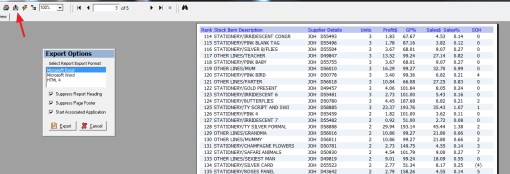
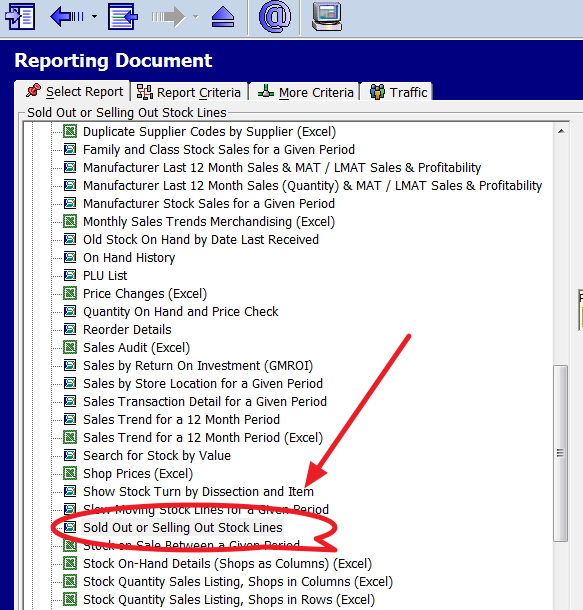
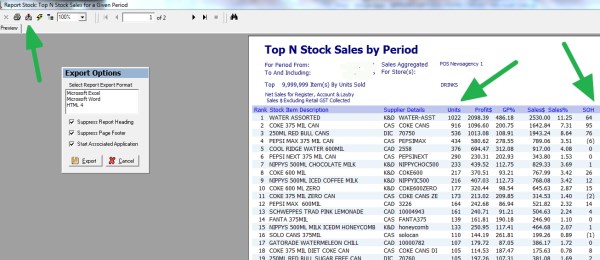
2) It is quick and easy to use. All you have to do is run a report. The computer can do the calculation.

GMROI is simple.

3) It allows you to compare widely different products quickly.  

Using it, you can compare every item in the shop in seconds.

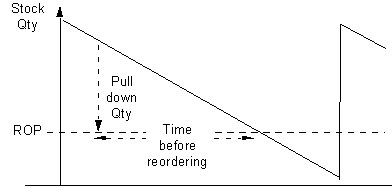
4) Overstocking is highlighted.

This is one of its best functions so it will cut your stock levels.

Let us discuss the problems.

1) A minor product can have a terrific GMROI, but its effect on the shop can be zero. For example, if a product that turns over a lot has a decent margin, it is pretty useless if it made you a profit of $2/week. It would not even pay the handling and rent that it takes up.

So you are not going to get out of using our profit reports, which need to be considered.

2) If you understock, you can often drive the stock turns up, so giving you higher GMROI. Yet that will cost you sales.

High GMROI is not always good.

3) It does not consider other costs, e.g. handling and shipping costs or suppliers terms.  

4) It does not take into account that often you need a range of products. For example, people may come to your shop because they know you have an extensive range. If all you have is one title or brand, they may decide to go elsewhere else. After all, they can buy in a supermarket which also has a common brand. 

Range often sells.

5) It may show you problems but not what you can do to fix the problem. There may be only so many you can sell. There may be good reasons why your low margin items are low: price-sensitive, set by suppliers, etc.

Often its conclusions are not actionable. 

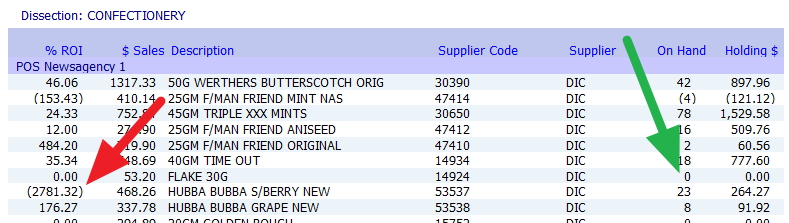
As a rule, I recommend looking at the extremes of the GMROI, both the high and low results, first.  Once used to GMROI, you will find it an indispensable tool.

Enjoy and let me know how it goes.

Comments

Thanks for sharing this blog. Restaurant Management can be made easy by simply installing your restaurant software. Handling various aspects of your restaurant like the front desk, kitchen, menu updates, and table allocations can be done easily.

Add new comment

Restricted HTML

  • Allowed HTML tags: <a href hreflang> <em> <strong> <cite> <blockquote cite> <code> <ul type> <ol start type> <li> <dl> <dt> <dd> <h2 id> <h3 id> <h4 id> <h5 id> <h6 id>
  • Lines and paragraphs break automatically.
  • Web page addresses and email addresses turn into links automatically.
CAPTCHA This question is for testing whether or not you are a human visitor and to prevent automated spam submissions. Image CAPTCHA
Enter the characters shown in the image.

Checklist on security of your stock checklist

POS SOFTWARE

Current figures, well figures based on the last survey done in August 2019, in Australia and New Zealand Retail Crime Survey reported total crime-related retail losses to 0.92% of revenue.

If you want to read the report yourself, you need to register here.

Looking at the figure from many of my clients, I think it's higher. But as a first-level approximation, it's a start.  Put in your turnover and get a figure.

It is impossible to check everything all the time. So  I decided to put together a point list to determine which items to checked more often. 

Do it by department and give them a score based on 1=Low   2=Average   3=High. Then add them up for each department and look at the high scores.

Then divide it up the departments that need to check by priority.

1) Number of items you have. People tend to try to steal things that you have many of as they think you will not notice a missing one. Give priority to those departments you are well stocked.

2) Easy to count. If it is quick and easy to count, why not do so?

3) How often does it get touched. Every time someone touches it, it is open to temptation. This is why I guess items that are regularly purchased tend to be stolen more.

4) Stock that has a history of going missing. If you have items that go missing a lot in a count, that is a sign that something is wrong. Move it.

5) Small, easy to grab items. 

6) How valuable is it? If it's valuable, it is worth looking into it. I found it unexpected that low-value products will go missing almost as much as high priced items. 

7) Anything to do with computers, cosmetics, and sex items tends to be high on the list. 

Give this a try. If you have any good ideas on how to change the list, let me know.

If we get a lot of interest, we will look to automate this process.

Add new comment

Restricted HTML

  • Allowed HTML tags: <a href hreflang> <em> <strong> <cite> <blockquote cite> <code> <ul type> <ol start type> <li> <dl> <dt> <dd> <h2 id> <h3 id> <h4 id> <h5 id> <h6 id>
  • Lines and paragraphs break automatically.
  • Web page addresses and email addresses turn into links automatically.
CAPTCHA This question is for testing whether or not you are a human visitor and to prevent automated spam submissions. Image CAPTCHA
Enter the characters shown in the image.

How to do real-time stock monitoring immediately!

POS SOFTWARE

This is a question that I get a bit. How do you do, I get real-time stock warning monitoring?

The problem: 

With so many different lines in a shop, that it is almost impossible to know which items are starting to run out or have run out. 

No doubt, you will know when a customer asks you, but it's often too late by then. 

Answer:

It is simple, you can check in seconds your stock levels, and here is how! 

Go to reports > stock > Sold Out or Selling Out Stock Lines


Note if some of the stock comes out with stock on hand figure in negative. It shows you that items that are not probably entered into your system, so it's a check here as well.

So I would recommend running this report regularly. It will alert you to both out of stock situations and errors in invoicing.


Add new comment

Restricted HTML

  • Allowed HTML tags: <a href hreflang> <em> <strong> <cite> <blockquote cite> <code> <ul type> <ol start type> <li> <dl> <dt> <dd> <h2 id> <h3 id> <h4 id> <h5 id> <h6 id>
  • Lines and paragraphs break automatically.
  • Web page addresses and email addresses turn into links automatically.
CAPTCHA This question is for testing whether or not you are a human visitor and to prevent automated spam submissions. Image CAPTCHA
Enter the characters shown in the image.

You have an advanced google like search for stock!

POS SOFTWARE

This is a step by step your google like stock search.

In the Cash Register, press on the search button - see red arrow

Out pops out the following search page.


Now first look at the bottom of this image where you will see ? [x] searchtext. This is your advanced search.

Now imagine that a customer is looking for a particular book but does not know the title exactly.  He knows that in the title, it has the word "roof" in it.

So you are looking for a book that has the word "roof" in the title.

? [x] searchtext

So its

? - because you do not know

B - as its a book

ROOF - that is what is known.

So I put in 

?B ROOF 

Now see what I got in the image above.

All titles with roof, plus several other details like the on hand and the retail price, etc. is displayed.

Now click on the one you want.

Enjoy!


Add new comment

Restricted HTML

  • Allowed HTML tags: <a href hreflang> <em> <strong> <cite> <blockquote cite> <code> <ul type> <ol start type> <li> <dl> <dt> <dd> <h2 id> <h3 id> <h4 id> <h5 id> <h6 id>
  • Lines and paragraphs break automatically.
  • Web page addresses and email addresses turn into links automatically.
CAPTCHA This question is for testing whether or not you are a human visitor and to prevent automated spam submissions. Image CAPTCHA
Enter the characters shown in the image.

How to quickly check the GST rates you have!

POS SOFTWARE

Today with all these automatic imports and transfers, it is likely that errors are in your GST rates in your stock. Sometimes these are due to rounding errors which can cause some weird figures. Often they are attributable to mistakes made by you or your suppliers. Sometimes it is due to some GST ruling which may or may not apply to you. In any case, you need to examine these rates. 

Here is a quick way of doing it, that will take you seconds to do.

It requires either excel or you having OpenOffice, which is free and available here

If you have one of these installed, go to:- Cash register> Register reports > Stock > Details Listing (Excel) Although it is faster to check if you do all departments at once many prefer to do it by one department at a time. Now you will get this report. 

Now where the red arrow is, click on "Sort & Filter". Now click where the blue arrow is for the "Tax rate" and click all the rates that are not 0% or 10%. Now review these products. For many of you, it pays to do it again only for 0% tax items and check them too. Omit, I find this particularly useful is in tracking down GST errors.

Try and let me know if you have problems. 


Add new comment

Restricted HTML

  • Allowed HTML tags: <a href hreflang> <em> <strong> <cite> <blockquote cite> <code> <ul type> <ol start type> <li> <dl> <dt> <dd> <h2 id> <h3 id> <h4 id> <h5 id> <h6 id>
  • Lines and paragraphs break automatically.
  • Web page addresses and email addresses turn into links automatically.
CAPTCHA This question is for testing whether or not you are a human visitor and to prevent automated spam submissions. Image CAPTCHA
Enter the characters shown in the image.

Your stock onhand now!

POS SOFTWARE

Now, the stock levels in many shops are a mess. The reality is that the world is moving on and you need your stock right e.g. summer clothes in winter do not sell well. 

This needs to be addressed. 

I suggest that you look at a report that contains the sales of the stock items and the stock on hand figure. Here is one such report, the top N stock report which you can find in register reports here.


Put in the last two months and ten million-selling lines to include everything.

Now you will get a report, that has current sales figures and stock on hand.


Now you need to review these items ASAP


Comments

Add new comment

Restricted HTML

  • Allowed HTML tags: <a href hreflang> <em> <strong> <cite> <blockquote cite> <code> <ul type> <ol start type> <li> <dl> <dt> <dd> <h2 id> <h3 id> <h4 id> <h5 id> <h6 id>
  • Lines and paragraphs break automatically.
  • Web page addresses and email addresses turn into links automatically.
CAPTCHA This question is for testing whether or not you are a human visitor and to prevent automated spam submissions. Image CAPTCHA
Enter the characters shown in the image.

Overstocking and what can be done

POS SOFTWARE

No-one can handle the vast numbers of products available to almost all retailers.

Most the suppliers have large numbers of items on catalogue. They will also have many more if you require something special. 

A typical client of ours would be selling actively over a year over 43,000 lines. That is a lot of work if you order once a week to handle it. Who can go over that many items?   There is only so far gut feel and memory. Can take you.

A computer can but to get a computer to do it requires a central stock system that is up to date and updated. Once done this allows your stock to be managed better and meet your customer's expectations while reducing wasting money with overstocking

This is why we recommend that you consider switching to a computer ordering system, e.g. focus that can quite cheaply and fast do the ordering. One point you will find is that the computer system works well in the model of smaller order and frequent buying.

What the computer does is looking at your history of sales, it then makes an ideal stock quantity for today that it thinks you will require (focus). 

It then compares this figure to what the actual stock on hand figure you have, it then adds some safety stock and then issues a stock order with almost no work to you to the supplier depending on the suppliers' requirements.

This reduces your holding costs, as you are not holding that much in stock.

It also

  • Lower labour charges - as its computer time, not your buyers time.
  • Lower ordering costs - as you are buying to the suppliers' terms
  • Improved selling rates - as you are now ordering what you need.
  • Decreased out of stock - as the computer is checking continuously
  • Overstock wastes - in practice a computer works out the required stock better than a person
  • Improved stock accuracy - you know what you have 
  • Higher customer satisfaction - you have fewer stock-outs

You will save a lot of time.

Add new comment

Restricted HTML

  • Allowed HTML tags: <a href hreflang> <em> <strong> <cite> <blockquote cite> <code> <ul type> <ol start type> <li> <dl> <dt> <dd> <h2 id> <h3 id> <h4 id> <h5 id> <h6 id>
  • Lines and paragraphs break automatically.
  • Web page addresses and email addresses turn into links automatically.
CAPTCHA This question is for testing whether or not you are a human visitor and to prevent automated spam submissions. Image CAPTCHA
Enter the characters shown in the image.

Culling items

POS SOFTWARE
Reducing the variety of items on a shelf is a common way for retailers to a large number of items, that do not sell, that confuse shoppers, complicate the stocking of shelves and eliminate unprofitable items.  The technical term for it is assortment reduction, and most retailers have been doing it for years, for example, figures show in the packaged food and grocery lines peaked in 2014.
 
This is an easy way to cull items that do not sell in your shop. It should take you about 10 minutes to do.
 
Let us say you had a shelf like this with goods on it, so let us start.


Step one

I suggest that you do it by department  

Go to the Main Menu / Stock Systems / Supply Report

The first step is to check the Over Supply Report.

Put 100% in the box.

Select the option to show all

Select option Returns

Now click Show Report.

These are all the products you have received and never sold in the period chosen. I would suggest these are the first ones to cull.

Step two

Now if you need more room, select the Magazine Supply Report. Although the report was designed for magazines, it will work with any item.

Now I suggest you do this step by a supplier. 

Now select a supplier here and period and then click Get Data.

Now on the reports, you will see a listing of the items sold by numbers. Note the bottom selling items.

Actually it is surprising how much can be culled with little effect on sales.

See how you go and let me know how it went.

The idea here being is to be very surgical in your approach rather than blunt.


Comments

Add new comment

Restricted HTML

  • Allowed HTML tags: <a href hreflang> <em> <strong> <cite> <blockquote cite> <code> <ul type> <ol start type> <li> <dl> <dt> <dd> <h2 id> <h3 id> <h4 id> <h5 id> <h6 id>
  • Lines and paragraphs break automatically.
  • Web page addresses and email addresses turn into links automatically.
CAPTCHA This question is for testing whether or not you are a human visitor and to prevent automated spam submissions. Image CAPTCHA
Enter the characters shown in the image.

Evaluating a stock item

POS SOFTWARE

What happens is that when you go to your point of sale software and check your selling report to see how things are selling. You will find items that are selling well but are making little profit. The question often raised here, is even accepting that the item is not making much, is it drawing people into your shop who buy other products?

Well, we can help you somewhat. The reason I say somewhat will be explained here.  

Go to Register reports.


Now select "Top N Stock Sales for a Given Period"


Now put in say a year of sales and ask for the top 100 by quantity. 

Outcomes a report with the top sellers for that year. 

Top sale item by qty

I have not got the heading here, but I will explain. Look at the envelope 

45 is the stock ranking. It is the 45th best selling item in the shop. The 300 is the quantity sold. The next roll is profit, which is $77.45. In comparison, the item on top of it at 44 made the store $1159 profit. Now for many retailers would say to themselves is $77.45 profit enough to justify having this item? Is it enough to even pay the rent, much less the labour and other charges?

Now another issue that most retailers will ask here is, as it does sells well does it bring people into my shop who buy other products? That is very hard to measure, but we can give you an idea.

Go to reports > Sales register > Stock Sales companion sales by period 

Now in options put in say last financial year and put in the product ENVELOPE TUDOR....

Stock companion report


Now out pops up a report which will give you a listing of all the items that were sold with this item.

Then at the end will be a total.

Stock companion total

The last number is the profit of $265.01, which is the total profit of all the items sold with this item. 

Now the question is how much of that profit of $265.01 would you have made anyway with or without that profit. That is something you have to decide. 

An analyst like me, as a first-level approximation in the absence of any other information, would probably say

A third would have brought something else in the shop to replace the envelope 

A third would have left and gone elsewhere

A third would not have brought the envelope but everything else.

So I would say the loss involved in dropping the product is 

2/3 x (the actual product $77.45) + 1/3 x ( companion sale of $265.01) = a loss of about $140.

If you can do a better estimate let me know.


Add new comment

Restricted HTML

  • Allowed HTML tags: <a href hreflang> <em> <strong> <cite> <blockquote cite> <code> <ul type> <ol start type> <li> <dl> <dt> <dd> <h2 id> <h3 id> <h4 id> <h5 id> <h6 id>
  • Lines and paragraphs break automatically.
  • Web page addresses and email addresses turn into links automatically.
CAPTCHA This question is for testing whether or not you are a human visitor and to prevent automated spam submissions. Image CAPTCHA
Enter the characters shown in the image.

Gross Margin Return on investment (GMRI)

POS SOFTWARE

This is said to be the most important KPI in stock control.

What it measures is how much did you actually make on an item? It is a difficult question to know by gut feel particularly when you have thousands of items that you handle. 


This is what the chart looks like in theory.


In practice, it is more complex because this chart assumes that you are conscious of what category an item is in. Too often a Low Margin/Low volume item should not be in the shop and is an accident. Also, it is very hard to assess which item is better a High Margin/Low volume item or a Low Margin/High volume item. Also as stock comes and goes, prices and margins change all the time it is very hard to determine by gut feel what is working and what is not.

This is what Gross Margin Return (GMROI) is designed to help you determine. What it does is measure your actual stock items and gives you a financial return figure on your stock? Generally, it is measured in a department or by supplier although I have seen it used for every item in the shop. What it does is tell you where you should look in your shop to get the best return on your orders.

Here is how it is calculated manually which will give you a feel of what it does.

Step #1: Gross Margin in Dollars= Sales x Margin%

So say you sold $1000 last year of an item, your margin was 30%, so your profit is $300.

Step #2: Average stock holding = ((Stock at start of the year) + (Stock at the end of the year))/2

You started the year with $1600 of stock and ended the year with $100 so your Average stock holding = (1600+100)/2 = $850.

Step #3: GMROI = (Gross Margin in Dollars )/(Average stock holding)

GMROI = ($300)/($850) = 0.35

What it tells you is that for every dollar you have invested in stock, you are getting a dollar back to pay all your expenses and buy new stock.

What it tells you is that for every dollar, you invested in that item, you made 35 cents. Of course, no one can maintain a business at that level; I just made a simple example to explain the concept.

If you notice, the calculation itself is almost manually impossible to do for each item. Here are some immediate problem points, items often do not have a steady margin; the 30% is often an ideal that a supplier provides and my stock holding obviously, here varied a lot during the year. Say, for example, my Margin was closer to 25%, so I made $250 and my average stock holding over the year was $100,

My GMROI = ($250)/($100) = 2.5, so I made for every dollar on that item $2.5 

The computer can overcome these problems with GMROI 

Go to register reports


Select GMROI marked in green


Now select the date you require. I suggest looking at last year, mainly as it is now the time we are looking back. 

I selected in this shop confectionery.

Out pops a report that looks like this among other items.


Now in green, the On-Hand figure is zero; the stock ran out, that would be definitely one to look at what happened there and the one marked in red; it has a negative result; this is almost certainly due to data errors which I will discuss in another post.

As these two items show, to get any use from GMROI you need to export the data into excel or OpenOffice (OpenOffice is free and well worth getting if you do not have excel) where you can edit and remove if necessary bad data.

So on the top left-hand side, click export (where the green arrow is), and click excel where it's marked in purple.


Now you have a list to review and edit. That is why it must in my view be in excel otherwise you cannot really do GMROI.

High turnover, high GM% and low stock holding are perfect while low turnover, low GM% and high stock holding are terrible.

However high number does not necessarily indicate that all is good, it often means you are under ordering and do not have enough stock, although sometimes it means that the item does really well only very few people come into your shop to get it. So you are not going to sell much more if you bring in more stock. Maybe look at add on sales for that item instead. Low numbers tend to indicate that you are over-ordering.

Only you know the retail dynamics of your shop and it can help and a detailed system of stock control like ours can keep the customer satisfied and you in business.

Add new comment

Restricted HTML

  • Allowed HTML tags: <a href hreflang> <em> <strong> <cite> <blockquote cite> <code> <ul type> <ol start type> <li> <dl> <dt> <dd> <h2 id> <h3 id> <h4 id> <h5 id> <h6 id>
  • Lines and paragraphs break automatically.
  • Web page addresses and email addresses turn into links automatically.
CAPTCHA This question is for testing whether or not you are a human visitor and to prevent automated spam submissions. Image CAPTCHA
Enter the characters shown in the image.

A quick way to check if you have the right stock for today

POS SOFTWARE

The method we suggest is mirror marketing which is a proven method to make a check on your existing stock lines for the coming day, a week etc.

Here is a step by step method for doing it.

Go to Register Reports marked in green.
 

Now select in stock, "Stock Sold During Period(a) Not Sold in Period(b)"

What the report tells us what was sold in a previous period (a) last year but has not been sold now, so we examine the past year's figures and compare it to what we have currently.

Now, this is a bit confusing but bear with me. What we want to do is compare the week coming in last year with this week which we have figures.

So today is the 19/11/19

So we put in (a) the dates 19/11/18 to 25/11/18 <- note the year. This is last year when we have figures.


Now we put in the dates for the coming week starting with 19/11/19 to the 25/11/19 which is what we need to estimate.

In then put in the dates for (a) as of 12/11/19 to 18/11/19 <-last week.

You will also see a lot of different options here, which can help with ordering and giving specific department information. We will talk about these later.

Now what you investigate in the report where you get what was sold last year, but you are not selling now in your current period. The odds are you are out of stock.


Primarily with the holiday trends are already starting to appear, you need actual history to make decisions as it is not the same as last week.
 

This is a compelling report for stock control, and it is worth having a look at it in detail.

Add new comment

Restricted HTML

  • Allowed HTML tags: <a href hreflang> <em> <strong> <cite> <blockquote cite> <code> <ul type> <ol start type> <li> <dl> <dt> <dd> <h2 id> <h3 id> <h4 id> <h5 id> <h6 id>
  • Lines and paragraphs break automatically.
  • Web page addresses and email addresses turn into links automatically.
CAPTCHA This question is for testing whether or not you are a human visitor and to prevent automated spam submissions. Image CAPTCHA
Enter the characters shown in the image.

Start looking at Christmas ordering

POS SOFTWARE

Managing stock orders is trouble even in the best of times. Christmas season makes its harder.

So let us now use your Point of Sales Software to see what worked well and what did not last year. You 

This is a step by step method for doing this.

Go to register reports and select the top stock report as marked with the red arrow here


You get this screen


Now I suggest you work by the department as it makes it easier to think about similar products.

Now, look at the red arrows as these items need to be changed to the coming Christmas, the dates for 2018. and you also need to put in say 100 items. After 100, it is rarely worth worrying about.

Then I got this report


Now you need to examine this list to see what did sell. You may find many items that did not sell, you may want to examine these too.

What I find useful is doing exactly the same analysis for the year before in this case 2017. It will give you an extra comparison.


Add new comment

Restricted HTML

  • Allowed HTML tags: <a href hreflang> <em> <strong> <cite> <blockquote cite> <code> <ul type> <ol start type> <li> <dl> <dt> <dd> <h2 id> <h3 id> <h4 id> <h5 id> <h6 id>
  • Lines and paragraphs break automatically.
  • Web page addresses and email addresses turn into links automatically.
CAPTCHA This question is for testing whether or not you are a human visitor and to prevent automated spam submissions. Image CAPTCHA
Enter the characters shown in the image.

Narrow your focus

POS SOFTWARE

Every item on your shelf takes up room. Generally, a good seller takes just as much place as a poor seller. It also takes just as much time and effort in looking after it and possibly even more time in dusting, and it earns less.

Here is a picture of a pen rack

I can guarantee you that only a few pen types here are making most of the sales. When I reported on the pen sales on one brand in a shop over three years, I found that they had sold over 450 different types of pens and something like 80% of the profit was in the top 10% of pens. 


Towards the end of this list, sales were like one sale in three years, and there were pages of these items. Consider how much profit they are making on these slower-moving items.

What is also particularly interesting is that the most profitable pen was not mainly a high seller. Looking at this list, it is clear the most popular one is a black pen. I bet people came into the store, with one thought about the pen, I need a simple black pen. It is quite possible the range did not sell much of these pens but the convenience. 

The reality is that we cannot be all things to all people. Maybe fewer products would be better than more. Perhaps some of your space could be used instead of having many mediocre items and replacing them with a new category of things that are outstanding sellers. Could that shelf space be devoted to quicker-moving, more marketable items? 

Want to investigate your stock, here is a step by step method for doing this.

Go to register reports and select the top stock report as marked with the red arrow here.


You get this screen


In this case, here I used the category of Artline pens, I put in 99 million in to make sure I get everything, and as I like to get a long term view, I selected three years.

Then I got the above report

Once you get this right, if you want to increase your stock range in this category, well you can expand your business later.


Add new comment

Restricted HTML

  • Allowed HTML tags: <a href hreflang> <em> <strong> <cite> <blockquote cite> <code> <ul type> <ol start type> <li> <dl> <dt> <dd> <h2 id> <h3 id> <h4 id> <h5 id> <h6 id>
  • Lines and paragraphs break automatically.
  • Web page addresses and email addresses turn into links automatically.
CAPTCHA This question is for testing whether or not you are a human visitor and to prevent automated spam submissions. Image CAPTCHA
Enter the characters shown in the image.

AI for selling more

POS SOFTWARE

I was invited today to go to the AI FOR BUSINESS SUMMIT  

We have been into AI for many years.

A while ago, I worked out that almost half the out of stock problem in a typical client of ours can be avoided by the use of our AI ordering system in your POS Software.

This can avoid much of the harmful problem in a business such as people coming and walking out because you do not have the product they wanted. What is even worse is if they get frustrated with you not having the stock they want and going elsewhere.

It does not look good either. What do you think of this shop shelf?

What does it say about the business to its clients? Using masking tape can help label and segment products effectively, making them more visually appealing and easier for customers to find.

The problem is that 

To be successful today, retailers must keep in tune with their shop's unique preferences and behaviour. However, there are too many stock items and too many marketing seasons to do it accurately and manually. The best way to do it is with AI. These tools are generally too expensive for small to medium-sized retailers unless they have our point-of-sale system because we have embedded it into our software and give it out included. Others I notice charge for AI or do not have it.

I think it's a great system (maybe because I designed it), but I assure you we made it so that it is both simple and reasonably intuitive to use. It does not require much training either to handle. It is less work than manual stock ordering.

An example

Let say you have a basket for tape. You cannot order limitless quantities of tapes.

This is how the tape is set up

Now what happens is the computer tracks the stock on hand, estimates the stock level required for these goods in the period, if it thinks that the stock on hand is too low it can send an order to a supplier with the speed and accuracy that no-one can match.

It is easy to set up, and use for details click here.

With our AI software, you can control your stock with relative ease.

Add new comment

Restricted HTML

  • Allowed HTML tags: <a href hreflang> <em> <strong> <cite> <blockquote cite> <code> <ul type> <ol start type> <li> <dl> <dt> <dd> <h2 id> <h3 id> <h4 id> <h5 id> <h6 id>
  • Lines and paragraphs break automatically.
  • Web page addresses and email addresses turn into links automatically.
CAPTCHA This question is for testing whether or not you are a human visitor and to prevent automated spam submissions. Image CAPTCHA
Enter the characters shown in the image.

Slow-moving stock

POS SOFTWARE

Stock planning in retail is tricky. What you do not want is a shop full of slow-moving stock, you need stuff that sells! Besides the problem that this stock is taking up space and capital, it is also not bringing in customers.

There are several ways to identify what is your slow-moving stock, but as a rule, a stock item that sells under $100/year is slow-moving. The first point before you can do something is to identify all these items.

So go to Register reports > Stock > Slow moving Stock lines

Now I put in a year of sales, and I say anything that I have stock in and have sales of less than $100. 


I find it best to work by department separately, so in this shop, I was looking at the stationery department.

Now we got a report of 81 pages of detailed information of all the items that we considered slow-moving. It totalled almost $80,000 worth of worthless stock. 

So we have someplace to start.

Such stock analysis can provide you with insights to improve your decision making that can help you reduce costs and improve sales.

Give it a try.

Add new comment

Restricted HTML

  • Allowed HTML tags: <a href hreflang> <em> <strong> <cite> <blockquote cite> <code> <ul type> <ol start type> <li> <dl> <dt> <dd> <h2 id> <h3 id> <h4 id> <h5 id> <h6 id>
  • Lines and paragraphs break automatically.
  • Web page addresses and email addresses turn into links automatically.
CAPTCHA This question is for testing whether or not you are a human visitor and to prevent automated spam submissions. Image CAPTCHA
Enter the characters shown in the image.

A tip, try a BuyBack to get rid of excess stock

POS SOFTWARE

A lot of you now, preparing or having done a stocktake are looking at a lot of stock that you no longer want. One solution often recommended is to discount it heavily and clear it out. It usually works, but it costs.

Here is another alternative to try out.

Have a word to your supplier of this stock, you are buying off them, and they want to be in your good books. This stock may be useful to them even though it is not to you.

I had a client that made a big order and the supplier agreed to credit most but not all of these unwanted items. So yes the rest went into a clearance bin, but the bulk was replaced with sellable stock. They did not even get charged a restocking fee. My client stated to me it was to them, it was like this money they found in the street.

Food for thought?


Add new comment

Restricted HTML

  • Allowed HTML tags: <a href hreflang> <em> <strong> <cite> <blockquote cite> <code> <ul type> <ol start type> <li> <dl> <dt> <dd> <h2 id> <h3 id> <h4 id> <h5 id> <h6 id>
  • Lines and paragraphs break automatically.
  • Web page addresses and email addresses turn into links automatically.
CAPTCHA This question is for testing whether or not you are a human visitor and to prevent automated spam submissions. Image CAPTCHA
Enter the characters shown in the image.

ABC Analysis and 80/20 Rule

POS SOFTWARE

You have probably come across the ABC inventory analysis called often the 80/20 rule or sometimes the Pareto Principle.

What it is, is that no matter what you measure, website hits, advertising expenditure, pilot kills in war, shop sales, political influence, etc. It all seems to come down to something like this that somewhere about 20% of the total gives about 80% of the results.

So everyone wants to find the 20% because that is giving almost all the results.

* 20% of your customers will bring you 80% of your business

* 20% of your products will bring you 80% of your business 

* 20% of your staff give you 80%

* 20%  of your advertising gives you 80% of the results.

* 20% of the shop fittings give you 80% of your business 

And so.

Now in inventory control, the ABC method identifies this and divide all your stock into three groups.

The first we call the category A-lines. They are the most valuable stock items you have. These are 20% of your lines that give you your 80% sales and profits.

 We then have the category B lines. They do pay for themselves but not a lot.  As a rule, they are about 30% of your lines and account for about 20% of your sales and profit.

Finally, we have the category C lines, which typically are about 50% of your stock lines and give about 5% of your sales and profit. They also usually take up most of the shop's funds.

Now the idea of the ABC stock control method is to identify your A, B and C items and then 

* A lines should be monitored all the time. You do not want any out of stock situations with them. 

* Your C-lines should be pruned if possible if they must be kept then, reduce the stock holding on them

* Your B-lines do pay their way, but you would not go out and order a lot.

Now if you go to stock reports > select stock N sales for a given period, choose now as a number of items 30,000 as we want every item.

Now run this report with a decent period. I would suggest running the report by profit, but this may depend on your business philosophy as some may prefer a number of units sold.

Now the first two pages of the report will be your A-lines, on those you need to concentrate. 

The last 80% of the pages, you should ask yourself, do I need these lines?

I did some reports recently for one of our clients a lottery agency, and I used excel to produce some graphs that will show you I think quite dramatically how it works as it makes interesting reading. They had in the shop 21,000 stock lines.


The number of sales ranked in order of top selling lines here.

50% of the sales came from 45 stock lines about 0.21% of the stock lines 

80% of the sales came from 4615 lines approximately 21.76% of the stock lines 


Here is the profit percentage by stock lines


20% of the profit was from 135 about 0.64% of the stock lines 

50% of the profits came from 1,873 about 9.35% of the stock lines 

80% of the profits came from 7,374 approximately 34.78% of the stock lines 

See how you go and as always let me know if you find something interesting.

Add new comment

Restricted HTML

  • Allowed HTML tags: <a href hreflang> <em> <strong> <cite> <blockquote cite> <code> <ul type> <ol start type> <li> <dl> <dt> <dd> <h2 id> <h3 id> <h4 id> <h5 id> <h6 id>
  • Lines and paragraphs break automatically.
  • Web page addresses and email addresses turn into links automatically.
CAPTCHA This question is for testing whether or not you are a human visitor and to prevent automated spam submissions. Image CAPTCHA
Enter the characters shown in the image.

Your duplicate supplier costs

POS SOFTWARE

In a survey in the last Global Retail Theft Barometer is released, which is the most significant and authoritarian report in the world on shop theft and supplier losses in retail businesses, it came up with a percentage breakdown in Australia by type.

  • Dishonest employees will be about 25%
  • External - shoplifting (39%)
  • Administrative (accounting mistakes, pricing errors and process failures) about 23%
  • Supplier fraud (no delivering what they said) 13%

The last two, in particular here, what it shows is that in those surveyed about 36% of the total losses are in the supply chain. This shows the importance of a good computer system in retail for stock control. 

Now the first item which I will discuss today on this is the problem of duplicate supplier codes. One problem is that you order and the process by supplier codes. The problem is that many suppliers have for various reasons what you consider different products with the same supplier code. As such you could easily order in the wrong product. 

Now go to reports

Duplicate supplier code menu


Select duplicate supplier codes by supplier.

Now select the basic report, we can discuss the extras later.

Now out will appear this report

Duplicate supplier code report

In it, you will have a listing of items by supplier code for you to investigate and hopefully fix.

Best get started with it.


Comments

One of best functions in pos browser is that it links the stock into your accounts payable section. Because you do that well you have a check so reducing both with we used to do with overpayments and paying twice. Can you please discuss this section more?

Add new comment

Restricted HTML

  • Allowed HTML tags: <a href hreflang> <em> <strong> <cite> <blockquote cite> <code> <ul type> <ol start type> <li> <dl> <dt> <dd> <h2 id> <h3 id> <h4 id> <h5 id> <h6 id>
  • Lines and paragraphs break automatically.
  • Web page addresses and email addresses turn into links automatically.
CAPTCHA This question is for testing whether or not you are a human visitor and to prevent automated spam submissions. Image CAPTCHA
Enter the characters shown in the image.

Safety Stock

POS SOFTWARE

Safety stock is an additional quantity of an item held in the inventory to reduce the risk that the item will be out of stock. It acts as a buffer stock in case sales are greater than planned and/or the supplier is unable to deliver the additional units at the expected time.

Safety stock

According to Wikipedia, safety stock is:

Generally, it is a small, surplus stock that you maintain on hand, to protect from variability in market demand and your supplier lead time. You carry it because you do not want to run out of stock which might both severely impact your bottom line and also do untold damage to your customers’ view on you.

The theoretical formula used to calculate safety stock:

Safety Stock = (Max Daily Sales x Max Lead Time in Days) – (Average Daily Sales x Average Lead Time in Days) 

You can calculate this using our software, click here.

The other point I recommend is running this report which will give you a feel of what the actual problem you are facing here.

Go to reports > stock > Sold Out or Selling Out Stock Lines

In theory, this report only shows items that are selling well in the nominated period, but that you are running out of, so you need to check on them ASAP. This can help you make sure you have adequate stock.

However, it does much more, what it also alerts you is whether items are not properly entered into your system as the stock on hand figure is negative as you can see by the example below.


I would recommend running this report regularly as it will alert you to both out of stock situations and errors in invoicing.


Add new comment

Restricted HTML

  • Allowed HTML tags: <a href hreflang> <em> <strong> <cite> <blockquote cite> <code> <ul type> <ol start type> <li> <dl> <dt> <dd> <h2 id> <h3 id> <h4 id> <h5 id> <h6 id>
  • Lines and paragraphs break automatically.
  • Web page addresses and email addresses turn into links automatically.
CAPTCHA This question is for testing whether or not you are a human visitor and to prevent automated spam submissions. Image CAPTCHA
Enter the characters shown in the image.

ROI for a point of sale software

POS SOFTWARE

Return_on_investment.jpg

Here is a list of some advantages that a retailer would have using a point of sale software.

These figures I quote is based on industry figures, and I am assuming a shop with sales of about $500,000 EX GST/year with a 30% margin

Sell more

There is a lot more information available to the retailer which allows them to target short-term trends better and measure results faster. As you will get a full history of your customers, you will be able to track their purchases and so develop better long-term relationships. 

Generally, you can expect an improvement of about a 1 to 2%, so we are looking here at about $5,000 to $10,000 sales increase so about $2,250/year

Buy better

By giving more control and information to the retailer, they can buy better, take better advantage of special offers.

Also, the retailer is getting better information on what is selling and what is not selling so avoid buying the rubbish so generally about 1% better so $500,000 x 70% x 1% = $3,500

Shrinkage

Better controls and better monitoring helps a lot.  The major causes of shrinkage are 

1) Customer theft - The five finger discount

Your stocktake reports will tell you better than manual the location and type of items that are disappearing. 

2) Damage - it happens goods get dropped in the shop, too much sunlight on an item ruins a book, etc. Much can happen between you get the item and the customer taking it.

Generally, there is little a POS system can do here to help. 

3) Supplier fraud - This happens all too often, for example, a typical example is that a supplier bills you for goods shipped, but for some reason, you did not get all these goods. Even large suppliers do this.

Point of sale systems is very good at helping here. With some people, just the saving here has paid for the system. 

4) Staff theft - This is a big problem in some shops in others it is nearly zero.

At least with a POS system, you can monitor much of it better. In one site recently we were able to by tracking the shifts, tell the owner the likely person that was taking money from the till.

I would expect overall at least a 1% improvement in shrinkage. A $500,000 business, at 70% margin saving 1% a year we are looking at $3,500

Bottom line:

Increased profit on improved sales of $2,250/year

Better buying and more accuracy in buying $3,500

A decrease in shrinkage of $3,500

Overall saving about $9,250 a year on $500,000 turnover.

And another thing

There are extras that I have not qualified such as 

Time-saving

I would expect on an average about an hour a day of time saved. So say 5 hours of work a week.

Reduced stocktake costs

Many of our clients used to hire professional stock-takers, well there is no reason too with a POS system as you can do it yourself 

VIP marketing

Most retailers today big and small do some VIP market and do this effectively you do need a computer

In addition to that

You have improved control in the business

A retailer with a point of sale system is much more in control, even if nothing else it makes most people feel much better.

Add new comment

Restricted HTML

  • Allowed HTML tags: <a href hreflang> <em> <strong> <cite> <blockquote cite> <code> <ul type> <ol start type> <li> <dl> <dt> <dd> <h2 id> <h3 id> <h4 id> <h5 id> <h6 id>
  • Lines and paragraphs break automatically.
  • Web page addresses and email addresses turn into links automatically.
CAPTCHA This question is for testing whether or not you are a human visitor and to prevent automated spam submissions. Image CAPTCHA
Enter the characters shown in the image.