What often is required is the ability to create adhoc reports for specialised needs in our retail point of sale software. It is one of teh two criteria for smart software. The problem is often yes, you have the information on the report but what it has is not what you require.
So I am going to show you step by step how to create such a report.
Say, for example, you wish to know the average days to sell your existing stock inventory. If your average days is low, you may be running the risk of going out of stock. On the other hand, if you’re taking a long time to sell your stock, you probably are carrying too much slow-moving stock and there is a real danger that some of it could turn into dead stock.
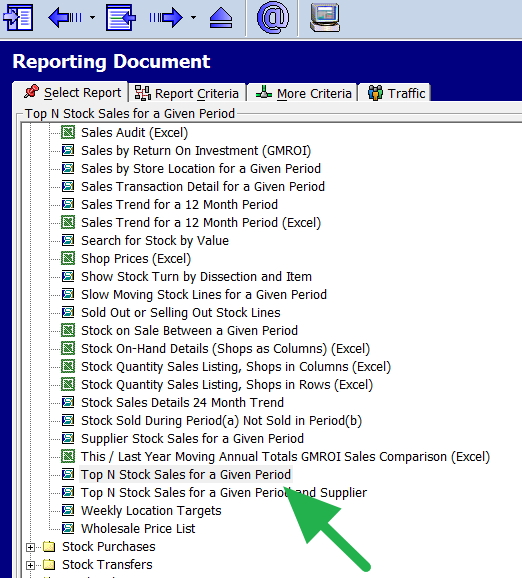
So we look at a report that contains the sales of the stock items and the stock on hand figure. Here is one such report, the top N stock report which you can find in register reports here.
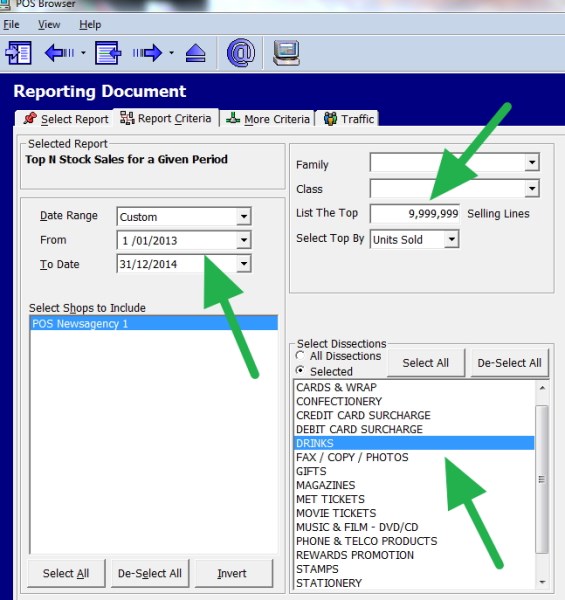
We then put in a period in this case, I will use two years because I like a lot of history and for this, example we will select the drink department. Note I put in about 10 million-selling lines to include everything.
I then get my report, it has got my sales figures and stock on hand.
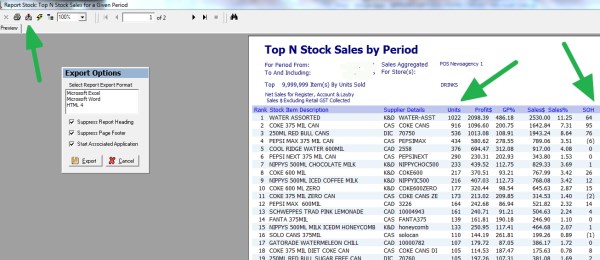
I then get my report, it has got my sales figures and stock on hand.
Since I want to make an adhoc report, I press export (on the left) with the green arrow to go into excel. If you do not have excel, you can use a free product openoffice which is available here.
http://www.openoffice.org/download/
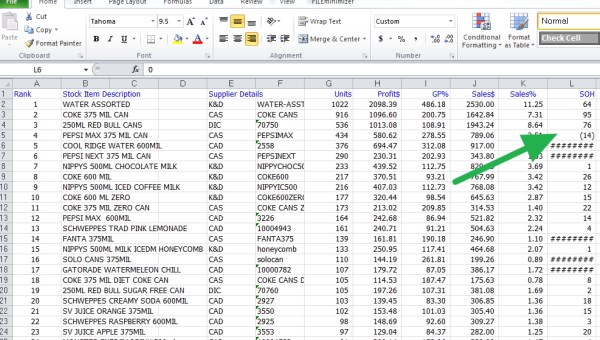
Now once we put it into excel, note in green that one stock item (which, by the way, I put in) is negative. That one would needs to be investigated, as negative stock means that there is something wrong but the rest looks okay.
Now for our purposes here we do not need Profit, GP or sales figures.
So I highlight the columns, right click and then click delete 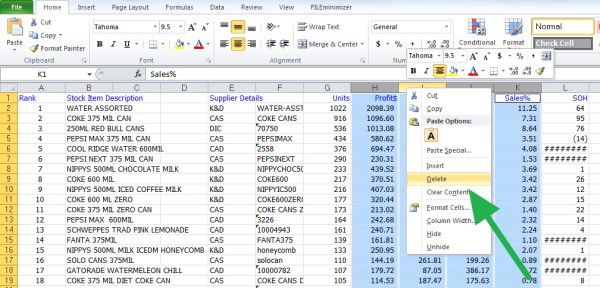
and get rid of them.
Now I want to add my formula, which is the Stock on hand figure by the sales divided by two years x 365 days. Although I am not doing it here, normally I would add 20% more, just for buffer stock.
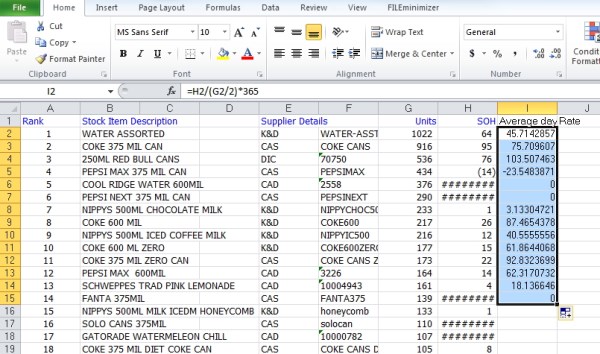
I then drag the formula down.
And get this but its a bit confusing with all these decimal places as you can see, so I right click the column and change its format to one decimal place.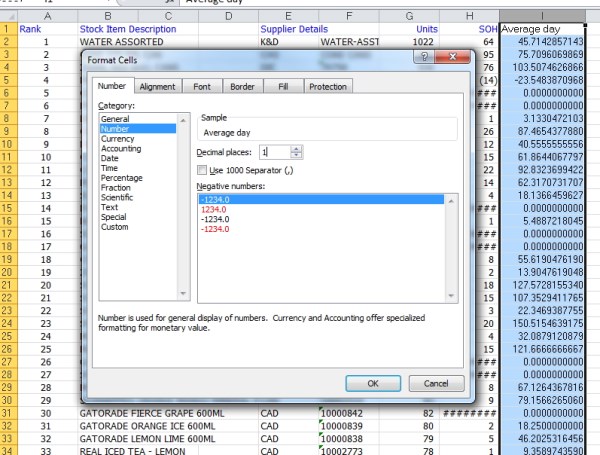
So now I have this.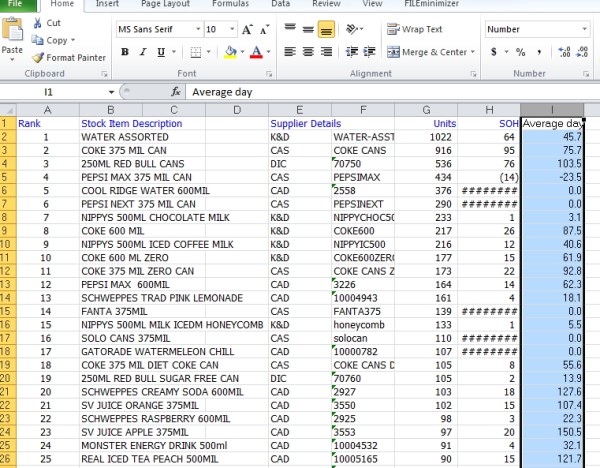
Overall clearly here I am way overstocked and am buying too much. I can also see although water assorted is my best seller, I am overstocked on it as well, as I am on Coke. Conversely, I do not have enough Nippy 500ml chocolate milk. Furthermore, I am out of Pepsi Next, and I need to investigate Pepsi Max...
Now I could use the filters, but we will discuss this another time.
If you are not using adhoc reporting, you are missing out a lot on the power of your point-of-sale system.
If you are not sure how to do it, we do run online courses to help you.


