Find your actual margins
Supplier Margins Are Often Wrong: Here’s How to Find the Truth
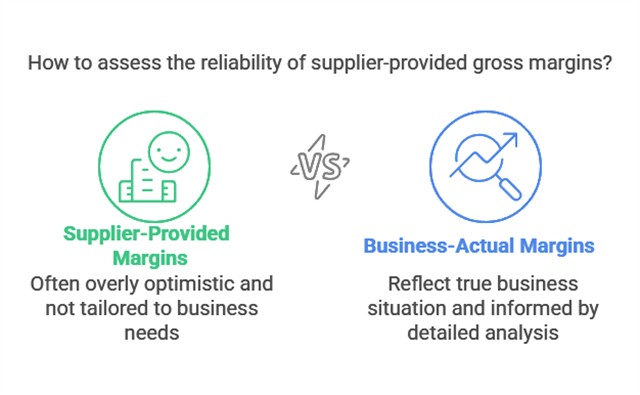
Understanding your actual profit margins is the only way to make a profitable shop. While suppliers often promise healthy returns, the reality of retail with shrinkage, damage, and necessary discounting means your actual number is probably much lower.
For retailers, relying on these "best-case" figures can be dangerous. It's time to stop guessing and use your Point of Sale (POS) system to find the truth.
The "Margin Illusion" Explained
Suppliers and sales reps usually quote a margin based on a perfect scenario: buying at the list price and selling at the Recommended Retail Price (RRP). They rarely account for the hidden costs that happen in a real shop. Even good sales reps often repeat these "best-case" figures because that is what they have been given. They avoid the "leakage" that happens on your floor. In the real world, your margin shrinks every time a staff member offers a discount, a product is damaged, or stock is marked down to clear.
The Real Math: A Quick Example
Consider a gift item you buy for $10 and sell for $20.
- Supplier Promise: "100% Markup" or 50% Gross Profit.
- The Reality: If you have to discount that item by just 25% to clear the last few units, or if one breaks, your actual margin across that line might drop to 33% or lower.
If you build your budget on 50% but only bank 33%, your badly overestimating.
How to Verify Your Margins in Your POS System
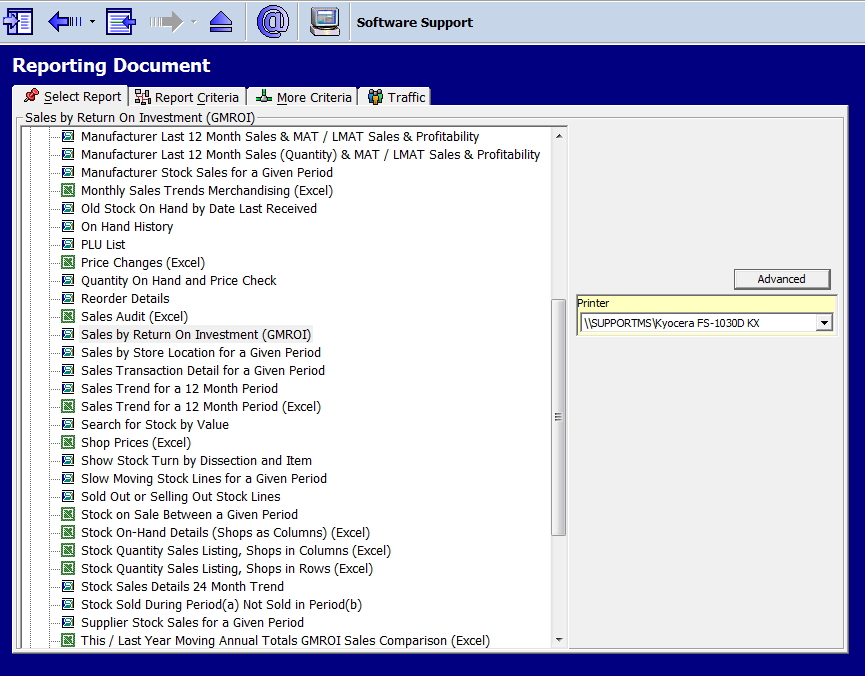
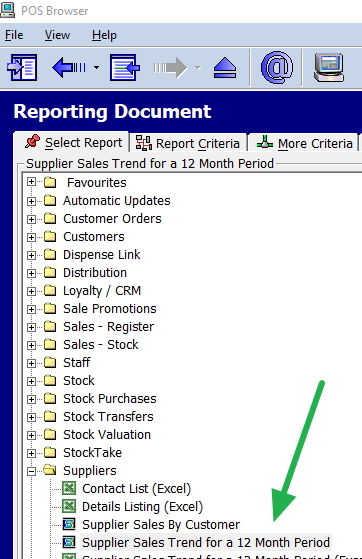
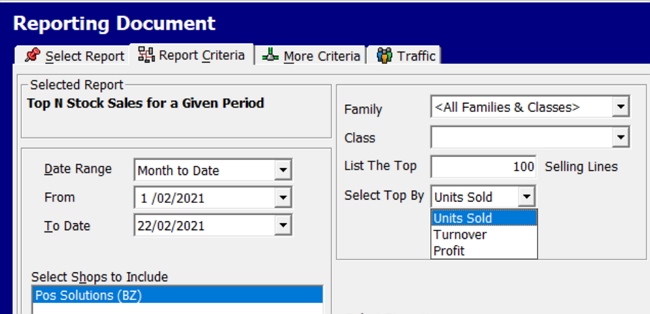
To fix this, verify your margins using your own sales data. The most powerful tool for this is the Discounted Item Sales Summary in your POS software.
Step 1: Getting the Report
Don't rely on total store averages; get specific.
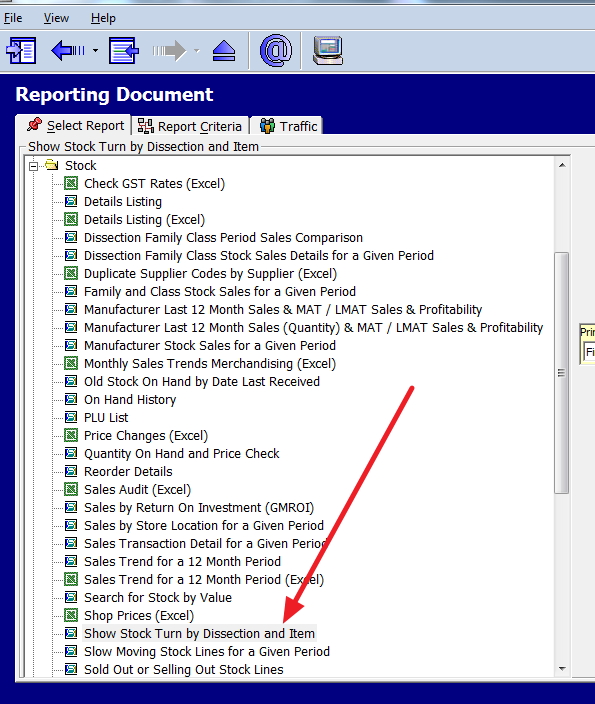
- Navigate to Sales > Discounted Item Sales Summary in your POS menu.
- Select a meaningful date range (the last 12 months is ideal to smooth out seasonal spikes).
Step 2: Reading the Data
Once you have the report, look for the gaps between the List Price and the Average Sell Price. This report reveals exactly where you are discounting by quantity and by price. [conversation_history:1]
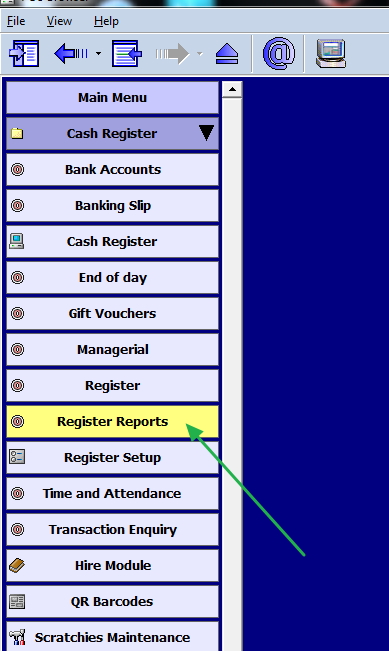
Now in sales, select the "Discounted Item Sales Summary."
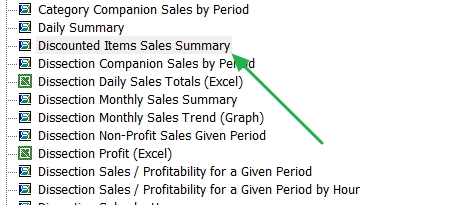
Pick a period. I suggest the last 12 months and now check; I would recommend it as a first attempt by the department.
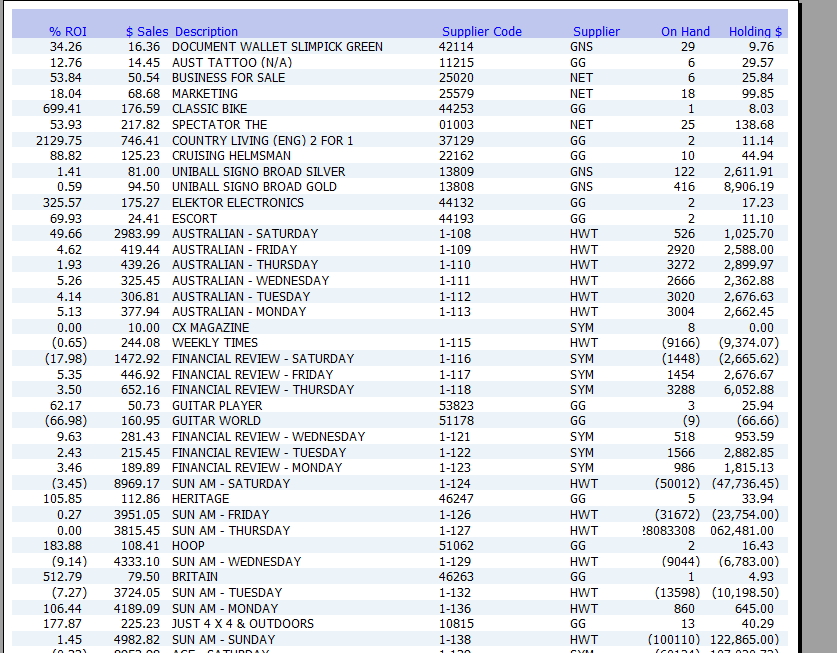
Now you will get a detailed report of where you are discounting by quantity and price.
You will quickly see which products—and which suppliers—are dependent on discounts to move stock.
The Importance of Regular Margin Analysis
Making margin analysis a regular part of your business review process is beneficial. Who said today's price and margin are valid tomorrow? By consistently monitoring your actual margins, you can:
- Quickly identify trends or changes in profitability.
- Make data-driven decisions about product lines, pricing, and promotions.
- Maintain a clear understanding of your business's financial health.
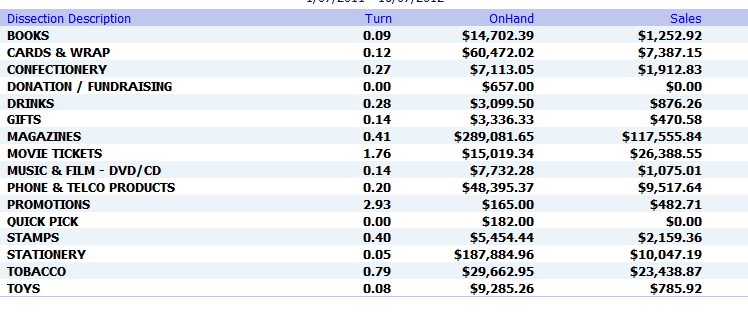
Remember, average retail profit margins can vary significantly by department.
Turn Data Into Profit: Actionable Strategies
Once you know your actual profit margin, you can stop "accidental discounting" and make profitable decisions.
- Pricing Strategy Refinement: Identify items with consistently low realised margins. Is the buy price too high? Is the RRP unrealistic? Adjust your pricing or drop the product.
- Supplier Negotiations: Your best weapon. Don't just complain; show the rep the data. Tell them, "I had to discount your candles by 20% to sell them, so I need a better buy price to keep stocking them."
- Inventory Management: Stop stocking items that only sell when they are on sale. Shift your budget to products that hold their margin without help.
- Discount Strategy Review: Ask yourself why you are discounting. If you are matching a big competitor on low-margin stationery, ensure you have a strategy to upsell high-margin items to cover that loss.
Conclusion
Margin margins move with time often yesterday's price and margin are not be relevant now. By making margin analysis a regular practice, you can identify trends. Don’t rely solely on a supplier's promises based on ideal theories.
Are you ready to uncover your actual profit margins? Start by delving into your POS data today and uncovering the true story behind your product profitability. Remember, knowledge is power in retail, and accurate margin analysis is key to unlocking your store's full potential.
Written by:

Bernard Zimmermann is the founding director of POS Solutions, a leading point-of-sale system company with 45 years of industry experience, now retired and seeking new opportunities. He consults with various organisations, from small businesses to large retailers and government institutions. Bernard is passionate about helping companies optimise their operations through innovative POS technology and enabling seamless customer experiences through effective software solutions.


