
Did you know that boosting your stock turn rate by just 20% could dramatically increase your profits?
What Are Stock Turns?
Stock turns, or Inventory Turnover, measure how often you replace your inventory over a given period. It is a crucial indicator of your shop's performance.
The Basic Formula:
Manually, it is calculated by
Stock Turn = (Cost of Goods Sold) / (Average Inventory Cost)
Step-by-Step Guide to Calculate Stock Turns Manually
Calculate your Cost of Goods Sold (COGS) for the period.
Determine your Average Inventory Cost
Add your beginning and ending inventory values
Divide by 2
Divide COGS by the Average Inventory Cost
For example:
COGS for the year: $100,000
Start of the year inventory: $25,000
End of financial year inventory: $15,000
Average Inventory: ($25,000 + $15,000) / 2 = $20,000
Stock Turn = $100,000 / $20,000 = 5
The Impact of Stock Turns on Profitability
Cash Flow Management: Higher turns mean you're not investing in the slow-moving stock. This improved cash flow allows you to reinvest in your business.
New stock: Moving your inventory faster keeps your stock current, reducing the risk of obsolescence.
Space Efficiency: You can use your valuable retail space better by keeping fast-moving items on hand.
The Magic Number: 12
Many retailers aim for a stock turn of 12. Why? It's simple:
You're likely paying suppliers monthly
A turn of 12 means you're selling out monthly
This means you do not pay for the stock you sell.
How to Check Your Stock Turns with POS Software
Our POS software has made inventory analysis more manageable than ever. Here's how to check your stock turns:
Open your POS software
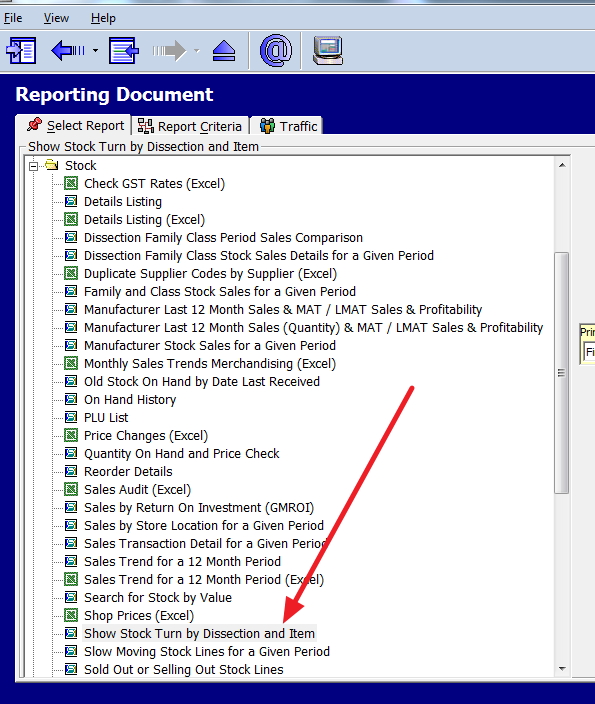
Navigate to Main Menu > Cash Register > Register Reports
Expand the 'Stock' section
Select "Show Stock Turn by Dissection and Item"
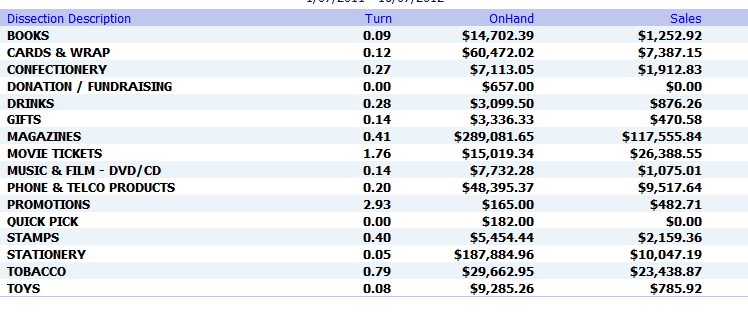
Here is the sample I produced showing the stock turns by department.
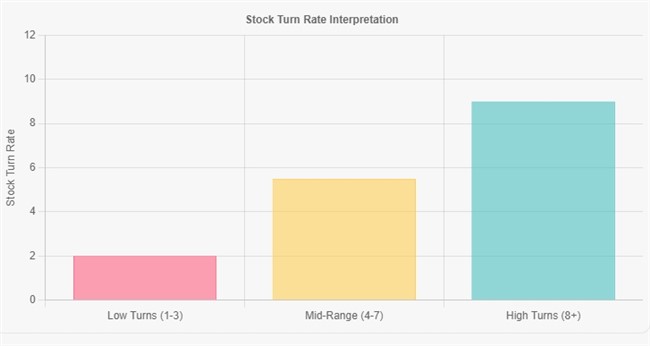
As a general rule, the higher the score of your stock, the better. This, however, is not always true; a stock turn that is too high often shows that you are understocked. For example, you have an item you could sell once daily, but you order one weekly. So every week, you have sold one, so at the end of the year, you have a score of 50, which is a great score, but you have lost 250 sales that you could have had because you could have sold one a day and all you have sold is one a week.
High Turns (8+): Great! But are you missing sales due to running out of stock?
Mid-Range (4-7): Good, but room for improvement.
Low Turns (1-3): Time to reassess. Are prices too high? Quality issues?
Common Pitfalls to Avoid When Optimizing Stock Turns
Over-optimizing: Pushing for extremely high turns can lead to being out of stock.
Ignoring seasonality: Some products naturally have different turn rates at various times of the year.
Neglecting customer service: Don't sacrifice having enough stock to meet customer needs to improve your turns.
Forgetting about lead times: Consider how long it takes to restock when planning your inventory levels.
Our POS systems offer a range of features to help with inventory optimization:
Real-time tracking: Get up-to-the-minute data on your stock levels and turns.
Automated reordering: Set up automatic purchase orders when stock hits a certain level.
Predictive analytics: Use AI-powered (FOCUS) forecasting to predict future stock needs. Our software includes this feature for free.
FAQ: Common Questions About Stock Turns
Q: What's a reasonable stock turn rate?
A: It varies by industry, but generally, a turn rate of 4-6 is considered good, while 6-12 is excellent.
Q: How often should I calculate my stock turns?
A: Monthly calculations are ideal for most businesses.
Q: Can stock turns be too high?
A: High turns may indicate that you're losing sales due to running out of stock.
Q: Should I use the same stock turn goal for all products?
A: No, different product categories may have different optimal turn rates. Use our POS data to set appropriate goals for each category.
Wrapping Up
Take time to analyse what these scores are telling you. This will help you to identify the actions required to improve profitability and return on investment.
Now, you need to analyse your stock and check each department to see what is working and what is not. A score signals bad sales and that you are more stock than you realistically need at any given time. Maybe you have a pricing or quality issue, but that department has a lot of obsolete stock. If so, move the obsolete stock to a different department, as it will not give you fair figures here.
A high score indicates greater profitability and a good return on investment, although, as I stated, it may also mean that you are not ordering enough.
Remember, every figure has a story.

