Point of Sale Software

Here are some Articles from the Blog Subject - Retail store layout -

How to Create a Useful Planogram of Your Shop

POS SOFTWARE

I've seen how helpful a good planogram can be for SMB stores. Since I've gotten questions about them, I want to share some practical tips on making a planogram.

This can:

  • Optimise your shop layout.
  • Boost sales.

A planogram shows:

  • What products go on the shelves.
  • How to arrange your products on shelves.

It makes shopping easier and, hopefully, drives more sales.

Why Planograms Matter for Retail Shops

Planograms are visual representations of your shop's layout, showing where products are placed and how they are arranged. For most of us in retail, nothing beats a planogram for visually showing what's happening in the shop.

A Cautionary Tale

Let me share a quick story. A client of mine wanted a shop fit-out. She told me that as her partner was a carpenter, he made what she wanted. He built it all right. Then she looked at the finished fit-out and said, “This is what I asked for, but not what I wanted.” A planogram could have saved her a lot of disappointment.

Uses of Planograms

  • Maximising sales by product placement.
  • Improving customer flow.
  • Optimising shelf space.
  • Enhancing visual merchandising.
  • Tracking profit.
  • Identifying shoplifting hotspots.
  • Analysing the number of sales per area.

I've had clients whose sales have jumped by tweaking their store layout based on a well-crafted planogram.

The Great Debate on Professional Planogram Software

When I started discussing planograms, our competitors all suggested that people use professional packages. Now you can use professional software, and it's pretty reasonable. However, they did not notice that these planograms look nice and are not straightforward to make or use.

Pros and Cons of Professional Software

Professional Software vs DIY Planogram Comparison

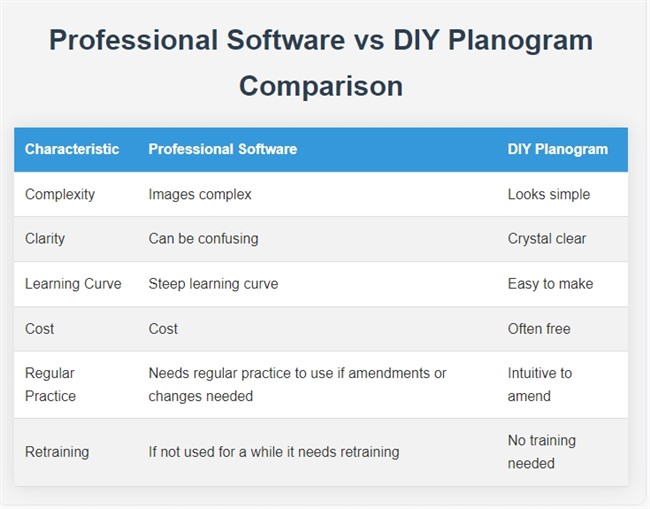
Professional planograms: you need to learn a lot before using them effectively. In my experience, if you're considering purchasing professional planogram software, I suggest opting for a monthly subscription. These costs are relatively reasonable; you have lost little if the package fails. Here is a decent discussion on this.

Most of us would be better off hiring someone who knows what they are doing rather than buying or renting such software.

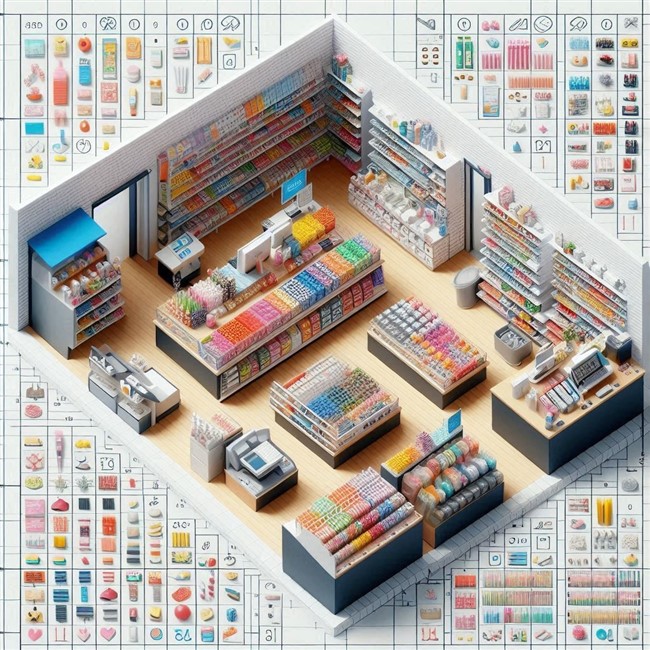
Here would be a typical result from a professional planogram.

planogram sample

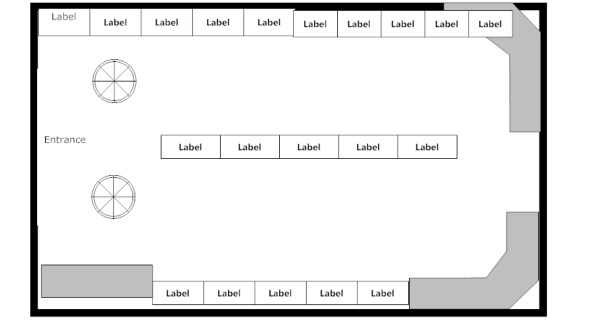
Here is a manual one.

Shop Planogram

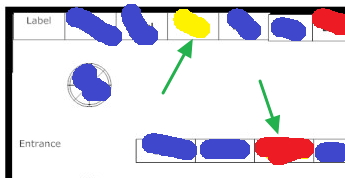
A diagram of your shop with your best sellers listed as:

  • Blue = Good
  • Yellow = Moderate to bad
  • Red = Very bad
  • Blank = Zero

It visually shows the shop's sales, but there is no denying that the professional one looks better. However, I think the manual one is clearer and more useful to most SMB retailers.

Step-by-Step Guide to Making a Planogram

When making a planogram, keep it practical. You do not need to show every minor detail in the shop. What matters is including the information that helps you make decisions. A good question to ask yourself before adding any details is whether this extra information is important to you.

Step 1: Gather Your Tools

You'll need:

  • A couple of large sheets of paper.
  • Some grid paper.
  • Pencil and eraser. A pencil's big advantage is that, unlike a pen, it's easy to rub out mistakes.
  • Ruler.
  • Triangle right-angle ruler.
  • Ruler with shapes (circles, triangles, squares), if possible.
  • Tape measure or laser distance meter, or just pace it out.

Pro tip: I prefer a laser distance meter. They're relatively cheap now, and one person can do all the measurements quickly.

Step 2: Measure Your Shop

At a minimum, your planogram should show:

  • The front door and counter.
  • All walls.
  • All fixtures and shelves.
  • Aisles and open walkways.
  • Power points, pillars, or anything fixed that affects the layout.
  • The main product areas or departments.

Now:

  1. On grid paper, draw a rough outline of your shop.
  2. Measure the largest dimension of your shop.
  3. Write down this measurement on the grid paper.
  4. Start at the rear of the shop and go around, measuring the outer parts. Write down every measurement.
  5. Start at the rear left of the shop and measure key details from left to right.
  6. Work your way to the front.
  7. Double-check by measuring from front to back.

Step 3: Draw Your Layout

Start with the rough sketch to get a grip on the situation. I find it useful to draft the initial version on scrap paper, work out many of the kinks, and only then start on my actual planogram.

  • Check that the measurements make sense.
  • Do not kid yourself that it's all correct; assume there is something you have done wrong.

Step 4: Draw Your Final Draft

  • Grab the larger paper to draw your shop layout.
  • Get the larger measurement, generally the shop length first.
  • Use this measurement to make a scale on your paper. Use a decent scale, for example, 1 cm = 1 metre or 2 cm = 1 metre. If you use something like 1.7 cm per metre, you are just asking for a calculation headache; use 2 cm.
  • Draw the other measurements.

Pro tip: In my experience, even experts take a few attempts. If you're not doing it a lot, you may need more, and that's perfectly normal.

Step 5: Copy Your Planogram

You now have a floor plan; make many copies. Later, you'll use these for different objectives, and it will save time because all you will need to do next quarter is use this floor plan.

Step 6: Use Your Planogram

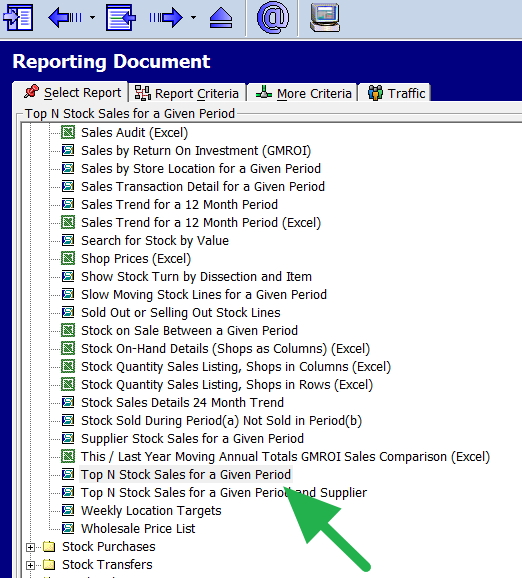
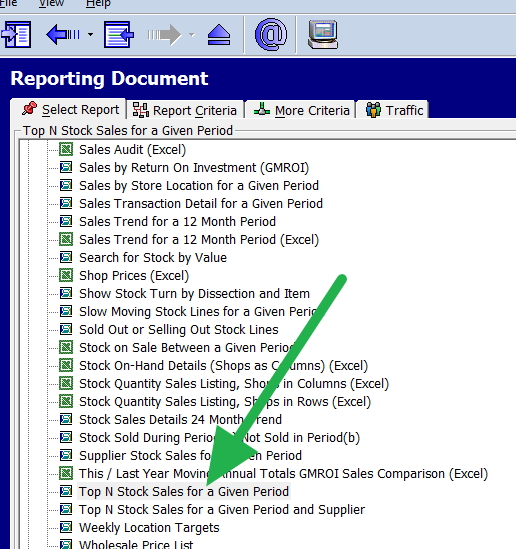
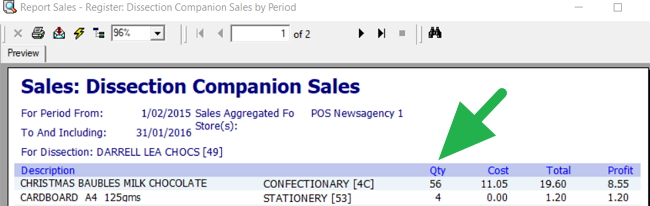
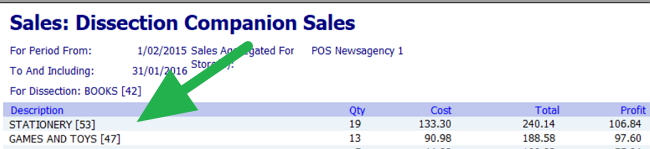
Mark on your planogram what you want to measure: dollar sales, unit sales, profit, shoplifting rates, and so on.

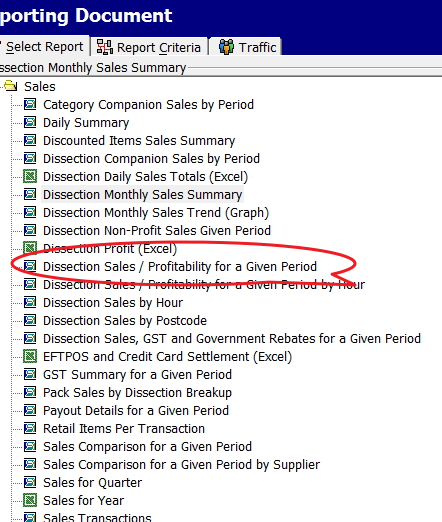
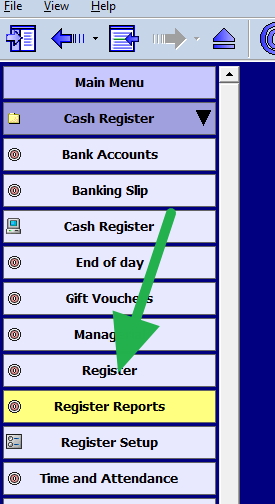
Select the appropriate report from your POS software, and divide the products into four groups:

  • Blue = Good
  • Yellow = Moderate to bad
  • Red = Very bad
  • Blank = Zero

Then mark the items on the planogram.

Step 7: Review and Refresh Your Planogram

A planogram is not a set-and-forget document. Once it is in use, review it. I know retailers who review it weekly, but I would suggest reviewing it quarterly. This keeps your shelf layout reflecting what customers are buying and how your range is changing.

A practical method is to review it at the start of each quarter: look at the quarter just finished, then look at the coming quarter from last year. This gives you a balanced view of recent and expected performance.

For example, at the start of Q2, run a Q1 report and compare it with last year's Q2. You may need to adjust for your future plans. That makes it easier to see which products need more or less space, and whether your current layout aligns with how customers shop.

What you will find is that you will catch issues that are easy to miss in day-to-day trading, such as slow sellers taking up too much room, fast sellers being underspaced, or seasonal lines staying on display longer than they should. A useful planogram helps you evolve as your shop does.

Conclusion

Your planogram does not have to be perfect. It does not even have to look professional. It simply has to help you see the shop more clearly and make better layout decisions. The worst hand-drawn planogram that you use is better than a polished one that sits ignored.

By taking the time to create a planogram, you're investing in your shop's future.

Happy planogramming!

FAQ

Q: What is the difference between a floor plan and a planogram?
A: A floor plan shows the physical shape of the shop, while a planogram shows how products or categories are arranged in that floor plan.

Q: What is a planogram?
A: A planogram visually represents some of your shop's features.

Q: Why do planograms matter for retail shops?
A: Planograms help people visualise what is happening in the shop. They assist in optimising space, improving customer flow, and maximising sales.

Q: Do I need professional planogram software?
A: Not necessarily.

Q: How do I start creating a planogram?
A: Start with the most significant dimension, usually the shop's length.

Q: What's the best way to measure my shop?
A: A laser distance meter is recommended because it's quick, accurate, and can be operated by one person.

Q: What should I include in the floor plan?
A: The entrance, the counters, walls, fixtures, shelves, aisles, and any fixed features that affect how the space works. I suggest adding the power points too.

Q: Where should best sellers go?
A: It depends. What is very important is that the customer notices them.

Q: How do I tell which parts of the shop are performing well?
A: A simple way is to mark areas by performance, for example, using colours to show strong, average, and weak parts of the shop.

Q: How often should I review my planograms?
A: I find in practice that for most shops, a quarterly review is a practical rhythm because it is frequent enough to catch problems without becoming a burden. In practice, what you find is that your customers do not want frequent changes.

Q: How do I know if the change was good?
A: Use your POS reports.

Q: How many attempts does it usually take to create one?
A: Even experts typically need three attempts: a rough sketch, a detailed version, and a final draft.

Q: What scale should I use when drawing one?
A: Use something that is easy to calculate.

Q: Why should I make many copies?
A: Multiple copies allow you to use the planogram for different objectives and planning purposes.

Q: Can a planogram help prevent layout mistakes?
A: A planogram can help visualise the layout before implementation, potentially avoiding costly mistakes in shop fit-outs.

Written by:

Bernard Zimmermann


Bernard Zimmermann is the founding director of POS Solutions, a leading point-of-sale system company with 45 years of industry experience, now retired and seeking new opportunities. He consults with various organisations, from small businesses to large retailers and government institutions. Bernard is passionate about helping companies optimise their operations through innovative POS technology and enabling seamless customer experiences through effective software solutions.


Add new comment

Restricted HTML

  • Allowed HTML tags: <a href hreflang> <em> <strong> <cite> <blockquote cite> <code> <ul type> <ol start type> <li> <dl> <dt> <dd> <h2 id> <h3 id> <h4 id> <h5 id> <h6 id>
  • Lines and paragraphs break automatically.
  • Web page addresses and email addresses turn into links automatically.
CAPTCHA This question is for testing whether or not you are a human visitor and to prevent automated spam submissions. Image CAPTCHA
Enter the characters shown in the image.

How to sell more

POS SOFTWARE

Identifying retail sales going up


Here is a surprisingly simple yet effective strategy way to increase sales in retail.

The Power of Product Placement

One of the most straightforward ways to increase sales is strategically placing your bestsellers, the items selling well in your shop. This technique is often overlooked but can significantly impact your bottom line.

In-Store Placement

Move your top-selling items to prime locations within your shop. These could be:

  • Near the entrance
  • At eye level on shelves
  • In high-traffic areas

By making your bestsellers more visible and accessible, you're making it easier for customers to find and purchase these popular items. These can be easy to find using your POS Software, which isn't just for transactions - it's a powerful tool for understanding your business. Here's how to use it effectively:

Identifying Your Bestsellers

Many retailers think they know their top sellers, but experience often tells a different story. Here's how to scientifically identify your bestsellers

Run a Top N Stock Report: This report is in the Register Reports section of your POS software.

Set some periods:

I suggest using it to:

    • Run the report for the past two years to understand long-term trends
    • Run it for the past three months to capture recent shifts in buying patterns

What I like is running it for yesterday, as the odds are what is a good seller yesterday will be a good seller today

  • So, run it for yesterday and what you have of today to capture the buying patterns now.

Analyse the Results: The report will show your stock items ordered by:

    • Quantity sold
    • Profit generated
    • Total sales

This comprehensive view lets you make informed product placement and stock management decisions.

Putting Knowledge into Action

Once you have your list of bestsellers, it's time to act:

  1. Investigate Product Locations: Physically check where these items are in your store.
  2. Customer Perspective Test: Ask someone unfamiliar with your shop to find specific products. It can reveal how easily (or difficult) customers can locate items.
  3. Adjust and Optimise: Based on your findings, rearrange your store layout to highlight your bestsellers.

The Impact of Small Changes

It's incredible how these simple adjustments can significantly impact your sales. By making your most popular items more accessible, you're making life easier for your customers and strategically positioning yourself for increased sales.

Remember, selling more isn't about drastic overhauls. Often, these minor, data-driven tweaks make the most significant difference. By regularly analysing your POS data and optimising your store layout accordingly, you'll be well on your way to boosting your sales and growing your business.

Add new comment

Restricted HTML

  • Allowed HTML tags: <a href hreflang> <em> <strong> <cite> <blockquote cite> <code> <ul type> <ol start type> <li> <dl> <dt> <dd> <h2 id> <h3 id> <h4 id> <h5 id> <h6 id>
  • Lines and paragraphs break automatically.
  • Web page addresses and email addresses turn into links automatically.
CAPTCHA This question is for testing whether or not you are a human visitor and to prevent automated spam submissions. Image CAPTCHA
Enter the characters shown in the image.

How to maximize Your shop's space

POS SOFTWARE

The better store space you have can drive sales and profits. A floor plan helps you look at your space from a new perspective. It lets you see how well your space works. We can study some key facts about your space. These facts show how well your space is used. Let's learn how to find these key facts, and then we can decide how to improve your space.

Why Space Performance KPIs Matter

You are paying for this space, so you must use it wisely. 

A floor plan helps you analyze your store's space and make wise choices. Let's explore how to calculate and understand these space indicators. This way, you can use data to grow your business.
You pay for your store space and want to use it well. Space indicators show how you use your shelves and areas. You see which spots work best by measuring sales or profit per shelf meter. This data lets you decide where to place products and manage stock. Better use of space leads to higher sales and happy customers.

Planograms

These are fundamental tools in retail today. They serve as detailed blueprints for arranging merchandise in a shop. They are visual representations that detail where and how retailers should place products on retail shelves or displays. 

There are a few critical elements to a planogram:

Shelf space allocation - Determining how much shelf space each product receives based on sales data to give high-demand products prominence.

Customer flow - Understanding how customers navigate and move through the store layout.  

Visual appeal - Creating attractive, balanced displays and colour schemes to improve the shopping environment.

Step-by-Step Guide to Calculating Space Performance

Follow these straightforward steps to calculate your space performance KPIs:

Measure Your Shelf Space:

Start by accurately measuring your store's linear metres of shelf space. I prefer using a tape measure, but pacing out the distance works.

Create a Detailed Store Layout:

We call this a planogram, and a typical one looks like this:

Store plan

Create a precise drawing of your store using a large sheet of paper or cardboard. I find it helpful if it is lined. Include key areas like shelves, departments, and product sections. This visual guide will make it easier to examine your significant numbers later. In practice, I need to make a few attempts, so I do it once or twice with paper and only then use cardboard. I then recommend photocopying that sheet and working on the photocopy. Then, you can quickly make a new planogram when required, as it has many uses, which I have already discussed here.

Gather Sales or Profit Data:

Now go to your point of sale system and get sales figures. Instead of using sales, I recommend using the number of sales and profit. So, I tend to use profit here because I think it's the most meaningful, but many prefer numbers. 

Sales breakdown report

Divide Sales/Profit by Linear Metres:

I prefer to use Excel for calculations, but many use calculators.

Divide the total numbers by the overall linear metres you have to give you an average. This will be your baseline.

Now divide the sales, number, or profit by the linear measurement. For example, if you had a $3,300 profit in that period and the shelf you paced is three steps, then your KPI = 1,100. Now go through each department and calculate the figures.

Categories Performance:

  • Blue: Very good
  • Green: Above average
  • Yellow: Average
  • Orange: Below average
  • Red: Poor

Now, we divide the results into five groups. I find it quicker to take the top items as they stand out and put them in my blue group, and then I dump the bad ones in the red. Now you are looking at the rest for every three yellows, a green and an orange. 

Visualise Results on Your Store Layout:

Use colour coding to mark the performance categories on your store layout drawing. This visual representation will help you quickly identify areas performing well and those needing attention.

Interpreting and Acting on Your Space Performance KPIs

See where the green arrow points. Apparently, there is something to investigate at these spots. See the green arrow pointing to red. This is a problem. Everything around is blue, so it is not the location. As this simple example shows, this KPI is a good indicator of how effective your use of space has been. You can use this to make stock, marketing, and layout decisions.

Although I have used profit here, try the same thing with numbers. What you want with numbers is to see that your clients are attracted to going deep into the shop.

  1. Identify Underperforming Areas: Look for sections marked in orange or red on your store layout. These areas may require changes in product placement, merchandising strategies, or promotional efforts to boost performance. Often, the suggestion here is to reduce the spot size.

  2. Analyse High-Performing Areas: Examine the blue and green sections to understand what is driving their success. Consider increasing the spot for the points marked in blue.

  3. Monitor Customer Flow: Pay close attention to areas where customers seem to be drawn in deeper or where they tend to linger. This technique can assist you in enhancing product arrangement and layout to encourage more browsing and impulsive buying.

  4. Adjust Stock Levels: Use this KPI information to adjust stock levels for various products or categories, ensuring you have the appropriate inventory in suitable locations. Increase the spot size for high-performing items and decrease it for underperforming items.

  5. Implement Strategic Promotions: Use your KPI data to check the underperforming areas. Alternatively, you may consider replacing underperforming items with other stock that sells better in those areas.

  6. Regularly Review and Adjust: Measuring and analyzing space performance KPIs should be ongoing. Review it regularly to maintain an optimized and profitable store layout.

Continuous Improvement and Customer Satisfaction

As discussed, measuring and analysing space performance KPIs is a continuous process. Regularly reviewing and adjusting your store layout and product placement based on your data ensures that your store is continually optimised for maximum sales and customer satisfaction.

The reality is that facts should have the final say, not your gut feeling.

Start now to maximize your store's potential. It takes about half an hour, and you will have much to consider. So start measuring your space performance KPIs today.

Add new comment

Restricted HTML

  • Allowed HTML tags: <a href hreflang> <em> <strong> <cite> <blockquote cite> <code> <ul type> <ol start type> <li> <dl> <dt> <dd> <h2 id> <h3 id> <h4 id> <h5 id> <h6 id>
  • Lines and paragraphs break automatically.
  • Web page addresses and email addresses turn into links automatically.
CAPTCHA This question is for testing whether or not you are a human visitor and to prevent automated spam submissions. Image CAPTCHA
Enter the characters shown in the image.

Allocate space based on stock performance

POS SOFTWARE

Visual representation of a well-organized retail store layout, highlighting prime locations for top-selling products.

Making the most of your space is essential to operating a successful store. You are losing money on valuable real estate on goods that do not sell but take up valuable space in your store.

Which goods ought to have the best placements on your shelves? You are losing money on valuable real estate that takes up every square inch of your store. Which goods ought to have the best placements on your shelves? Should you dedicate more space to that new item, or is it a flop waiting to happen? Savvy retailers know that data is the answer! By leveraging your point-of-sale (POS) software, you can turn sales numbers into better display decisions, maximizing your sales and profitability, so allocate space based on your stock performance.

Identifying Top-Sellers with Your POS Software

Determine which of your products are your greatest sellers—the things that people adore and keep coming back for—before you can optimize your store layout. Your POS system tracks every sale so that it can pinpoint these superstars quickly. Follow these simple steps:

Select register reports

Top Stock report

Now select Top N stock sales for a given period

Top Stock report menu

Try a month or even a whole season to get the best picture of your top-performing products.

Your report will provide a comprehensive list of top-selling items ranked by sales volume or revenue generated. This data lets you decide which products deserve prime real estate in your store.

Optimizing Top-Seller Store Layout

Your top-sellers report shows which products bring in the most money for your company, much like a treasure map. These are the products that should be in the best places in your shop. When distributing space depending on stock performance, keep the following in mind:

Easy Access

Can customers find and reach your best-sellers without a struggle? Put your best-selling items in the places of your business that are easiest to see and reach, like the front, end caps, or eye-level shelves.
 

Displays That Captivate the Eye

Display these goods to get your consumers' attention. Invest in eye-catching displays and merchandising to highlight your best-selling items and promote impulsive purchases.

Sufficient Stock Levels

Is there enough room for all your consumers would like to buy? Based on how well each product sells, allot floor or shelf space proportionately, giving your best-selling products more space and your slower-moving items less.

Pro Tip: Don't be scared to try new things! Try relocating a best-seller if its present location isn't working out well for it. Consider how much of a difference it makes.

Benefits of Allocating Space Based on Stock Performance

By allocating space based on stock performance, you can enjoy numerous benefits:

Increased Sales

Top-selling items should be prominently displayed to entice clients to make larger purchases and increase income for your company.

Enhanced Contentment with Clients

Making sure consumers can quickly locate and obtain the things they want improves the shopping experience and encourages repeat business.

Enhanced Store Appearance

Attractive displays and strategic placement of top-sellers create a visually appealing, organized store environment that invites exploration and browsing.

Better Inventory Management

Allocating space proportionally based on sales performance helps minimize clutter and excess inventory of slow-moving items, streamlining your stock management.

Continuous Monitoring and Adjustments

Remembering consumer preferences and buying patterns can shift over time is important. Therefore, it's crucial to review your sales data regularly and adjust your store layout accordingly. Set reminders to periodically reevaluate your top-selling products and adapt your space allocation as needed. This continuous monitoring and optimization will ensure your store remains responsive to your customers' evolving needs and preferences.

The facts do not lie.

Allocating space based on stock performance is a simple yet effective strategy for small retailers to maximize sales and growth. Using your POS software to identify top-sellers and optimise store layout can create a more engaging, customer-friendly shopping experience that drives business success. Embrace data-driven decision-making, and watch your sales soar as you make the most of your precious retail space.

Use space to maximize Your Shop's profits

POS SOFTWARE

Running a shop can be a problem if you don't have much room.  This is a common problem as most of us have more stock than we can display. Don't let that hold you back! You can turn your shop into a sales machine by understanding your customers and applying clever design tricks.

Why Your Store Layout Matters

A well-designed store does more than look good. It caters to your target customers' needs, guides them effortlessly through your space, and highlights your best products. When customers feel comfortable and understood, they're more likely to find what they need, linger longer, and buy more!

Know Your Audience: The Key to Smart Layout Decisions

Before rearranging shelves, take time to understand your ideal customers. 

  • Demographics: What's the age range, gender, and general lifestyle of your target shoppers? Guys are generally taller than women so that the items can be higher for them; for kids, the stuff must be right down low.
  • Shopping Habits: Do they prefer browsing leisurely, or are they in-and-out shoppers? If they want speed, you need the items at the counter so they can come in, do the sale quickly and leave quickly. Also, do they tend to come in alone or with others?
  • Pain Points: What problems do your products or services solve for them?

Your Secret Weapon: Your POS Data (and a Little Observation)

Your POS System can do much more than just be a simple cash register. It's full of clues about your customers and what they like to buy. 

Here's how you can use this data and watch what happens in your store to make smarter choices on how to arrange things:

Identifying Your Powerhouse Products

  • Best Sellers Report: This tells you precisely what's performing well. Place these top performers front and centre for maximum visibility. 

Go to the top N stock report, which you can find in the Register reports.

report highlighting best-selling items

We then put in a period, say the last two months; this will show you what is selling now, then when you have your list of best sellers nicely ordered by quantity, profit and sales.

Pay attention to the colors and sizes.

Think about using lights and signs to make them stand out more.

  • Companion Sales Report: This report unveils items that are frequently purchased together. Placing them strategically throughout your store can boost sales. Think of how grocery stores place snacks near the drinks section.

Go to Sales-Register > Dissection Companion Sales by Period.

Try looking for an abnormally high number of products for other stuff that sells well with that department. It is beneficial as it can help you select a product to display prominently near a department. This is a well-known method of increasing incremental sales that all majors use.

You take items that sell well with the products of another department and place some of them in that other department's area. There is nothing wrong with a good seller having a few spots in the shop. 

Like this one, a stand of good sellers in a prominent position is always good.


Giftshop stand

Retail analytics of inventory that sells with other items

As you can see here (green arrow), quite a few extra sales could be made by moving some other companies' chocolates close to Darrel Lea Chocolates. Darrel Lea may not like it, but ....

Another great use is more long-term. If grouped by department, you can get a feel of where you should position the display for the department. As you can see here by the green arrow, the books should be close to the stationery.

Report of best selling items

If people looking at your book can see your stationery, you may be able to make a few extra sales. 

These KPIs can give you ideas into which products to display prominently.

Traffic Patterns

Don't discount the insights you can gain by observing how customers move through your store. Are there areas that seem to get ignored? Do people get bottlenecked in a particular spot?  Are there areas that let the customer go too quickly? Use this information to fine-tune your layout.

Data-Driven Merchandising Strategies

Here are some practical ways to apply these insights:

  • Highlight Bestsellers: Your top-selling items deserve prime real estate. Give them prominent shelf space, consider eye-catching displays, and enhance visibility with strategic lighting and signage.
  • Promote Companion Products: Place items often bought together within easy reach.
  • Seasonal Shifts: Adapt your layout based on historical sales data.
  • Clearance Corner or Dump Bin: Designate a small "dump bin" area for heavily discounted items.  This is an excellent way of getting rid of dead stock.

More Tips for a Small-Space-Friendly Layout

  • Embrace Vertical Storage: Use shelves, hooks, and racks to reach upwards.
  • Let There Be Light: Good lighting makes your store inviting and highlights merchandise.
  • Keep it Tidy: A well-organized shop feels bigger.
  • Create an Illusion of more space: Light colours generally make a room feel bigger.
  • Get Creative with Signage: Clear signage to advertise your products.

Case Study

  • The Bookshop Upgrade: We had a client who sold books. He knew his customers loved to browse, so he arranged the bookshelves to create small, inviting nooks. He then put in a couple of comfortable chairs. This encouraged shoppers to linger and discover new titles.

Remember: It's an Ongoing Process

Trends change, and your customers' tastes evolve. Stay flexible, and don't be afraid to experiment!

The Bottom Line

By understanding your customers, using your data effectively, and getting a little creative, you'll create a retail environment that's welcoming, efficient, and drives sales – regardless of your square footage!

Add new comment

Restricted HTML

  • Allowed HTML tags: <a href hreflang> <em> <strong> <cite> <blockquote cite> <code> <ul type> <ol start type> <li> <dl> <dt> <dd> <h2 id> <h3 id> <h4 id> <h5 id> <h6 id>
  • Lines and paragraphs break automatically.
  • Web page addresses and email addresses turn into links automatically.
CAPTCHA This question is for testing whether or not you are a human visitor and to prevent automated spam submissions. Image CAPTCHA
Enter the characters shown in the image.

Better Customer Flow in Your Store

POS SOFTWARE

customer flow in a shop


In your retail store, carefully considering customer flow can greatly impact sales. Customers tend to explore your store in a clockwise pattern, usually turning left first when they enter. With this in mind, here are some tips for improving customer flow in your store. This takes in most shops about 15 minutes to do.

Make the Most of the Decompression Zone

I suggest you make your way to the front left of your shop. I find it a good idea to go with someone on your journey and discuss it. This is called the decompression zone of your shop.

This is where your customer mentally shifts from the outside world to your store. Upon entry, they take stock of your store, develop an opinion of your brand, and even subconsciously judge the pieces and prices they expect to find.

Since this left front area is the first thing customers see, use it for promotional displays to grab their attention. This prime real estate is perfect for showcasing new products, sale items, or seasonal offerings, but since people are not ready to buy, do not count on them buying here. Here they are thinking about your shop and its products.

Check the Aisle Space

As you move clockwise through your store, people do not like to feel cramped when shopping. So, you should allow for ample space for movement. Aisles must be broad enough to invite customers to browse, not bump into other shoppers, and—most importantly—pick up and carry items for purchase.

No Escape Routes on Your Journey

Be careful not to allow any "escape holes" for your customers to avoid going to the back of the shop. You want them to go to the back wall and then move forward to the front.

Draw Customers In

If you have staple items that people are coming in specifically to buy, like milk, place these in the back of the shop to draw customers inside.

Checkout Placement

Generally, the front right of a retail store is the best location for the checkout counter. This placement doesn’t distract people from shopping or occupy prime product display space.

By keeping these tips in mind as you lay out your store and place merchandise, you can optimise traffic flow to maximize sales. Let customer behaviour guide your design. If you want to know more of the theory click here

Add new comment

Restricted HTML

  • Allowed HTML tags: <a href hreflang> <em> <strong> <cite> <blockquote cite> <code> <ul type> <ol start type> <li> <dl> <dt> <dd> <h2 id> <h3 id> <h4 id> <h5 id> <h6 id>
  • Lines and paragraphs break automatically.
  • Web page addresses and email addresses turn into links automatically.
CAPTCHA This question is for testing whether or not you are a human visitor and to prevent automated spam submissions. Image CAPTCHA
Enter the characters shown in the image.