ATO Newsagent Benchmarks Guide
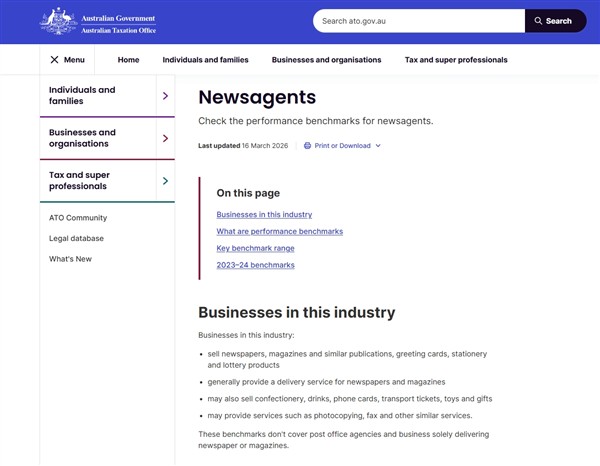
The best figures to use for benchmarking are always your own past results, whether from last month, last quarter, or last year. Still, looking at other people’s numbers can help you spot issues you might miss. The ATO’s newsagent benchmarks are the most useful and affordable option for this. The ATO has access to more data and resources than anyone else, and these are the figures they check first if they investigate your business. This guide will explain what these benchmarks are, how the ATO creates them, and how your POS system can help you use both your own data and the ATO’s figures together.
Key Takeaways
- Your own historical trading figures remain the single most reliable benchmark for your specific newsagency.
- ATO benchmarks are recent national averages derived from tax returns and are useful as a secondary point of comparison.
- Use the product mix to determine whether low-margin print sales are supported by higher-margin categories such as gifts and books.
- A POS System helps you track your own figures accurately.
- Your own figures are the real foundation of good decision-making.
Caution: The ATO expense categories probably aren't the same as yours, so watch that closely when comparing numbers.
What Are ATO Benchmarks?
ATO small business benchmarks are financial ratios derived from the tax returns of thousands of similar businesses across Australia. What is helpful is that the ATO groups this tax return information by turnover and then calculates average ranges for costs like stock purchases, rent, and total expenses, making it relevant to you. ATO Benchmark figures are available on their website.
Info: The ATO’s methods have been independently verified and found to be statistically sound, which is not always the case for other products. Their approach also matches international standards.
The latest figures are for the 2023–24 income year and are up to date, but keep in mind they do not reflect real-time trading conditions. Before you use any of this information, I want to be clear about my own view. The most meaningful benchmark is your own data, tracked over time, because it truly reflects your business. Other people’s figures, like the ATO averages, are helpful, but they should only be a second opinion.
Your Figures Are Best
There is solid research behind this. Studies from Australian banks and the US government show that individual businesses often do not follow the same trends as their wider market. For example, while bookshops overall might be struggling, I know many bookshops using our POS system that are actually doing well.
Your own trading history is the most reliable benchmark because it reflects everything unique about your business. No outside average can show your specific lease, your local competitors, or your regular customers’ habits. If your cost of sales has stayed at 52% for three years, that steady number tells you more about your business's health than any national average.
Tracking your own numbers over time shows trends that outside data cannot. For example, if your cost of sales jumps from 50% to 60% in one quarter, that is a much clearer warning than just being a bit outside the ATO range. If you see your rent-to-turnover ratio slowly rising over two years, you have time to renegotiate your lease before it becomes a problem.
However, if you only look at your own numbers, you might miss something important. It can be hard to know if a slow change is normal for your shop or a sign of a problem. That’s why it’s still useful to check other people’s figures, even if they are not your main focus.
Deriving and Using Benchmarks
The ATO works out these figures using tax returns from businesses that are properly listed as newsagencies. They leave out businesses like post office agencies or delivery contractors, so the averages are more accurate for real retail shopfronts.
Other people’s figures are valuable because they let you double-check your own trends. If your numbers seem fine but are far outside the ATO range, that’s a good reason to look more closely.
Calculating Cost of Sales
Cost of sales to turnover means the percentage of your sales that goes toward buying the stock you sell. You work it out by dividing your cost of sales by your turnover, then multiplying by 100. This number does not include rent, wages, or other overheads. For example, if you buy $100,000 of magazines and gifts and sell them for $200,000, your cost of sales ratio is 50%.
For 2023–24, newsagents with sales between $65,000 and $500,000 usually have a cost of sales between 42% and 59%. Those with $500,001 to $1,000,000 in sales are in the 47% to 62% range, and those above $1,000,000 are in the 55% to 81% range. Use these as a reference alongside your own yearly trend. If your cost of sales is always around 58% and the benchmark for your group is 47% to 62%, that steady result is a good sign, even if you are near the top.
You can find your own historical figures in your Point of Sale (POS) system. Run a rolling 12-month report from your POS software and compare it to the ATO ranges to see if you are deviating from your own trend.
Have your cost of sales, rent ratio, or total expenses changed a lot from your usual pattern? A sudden shift is a stronger warning than any comparison. After you have checked your own numbers, use the ATO figures as a second check. If your numbers are above the ATO range, it could be due to unrecorded sales, heavy discounting, supplier price rises, or stock losses. If both your own numbers and the ATO range show a problem, you should look into possible stock losses right away.
Remember, the ATO benchmarks do not prescribe an ideal mix; they reflect what similar businesses to yours report.
If your numbers are below the ATO range, it often means you have higher markups or a more profitable product mix. In my experience, it can also mean some costs were recorded differently than the ATO categories. Check this carefully. It does not mean there is a problem; it might just show you run your business efficiently. A newsagency that stays below the benchmark for years probably has a strong range of high-margin gifts and cards.
Comparing Other Expense Ratios
Total expenses to turnover includes all your business costs, like rent, wages, and utilities. As with cost of sales, compare this to your own history first, then check the ATO range.
Rent to Turnover
Rent is often your biggest fixed cost. Watching your rent ratio over time can reveal lease issues before the ATO comparison does. If your rent is much higher than usual, ask yourself if it is worth it and investigate why it has changed so quickly. Sudden increases flag inefficiency fast.
Why Product Mix Matters
Product mix means how much each category, like print, lottery, cards, stationery, and gifts, contributes to your sales. Watching how your mix changes over the years tells you more about your business’s direction than any outside average. For example, if gifts and cards have grown from 20% to 40% of your sales in three years, that is real progress.
How POS Systems Help
A good Point of Sale (POS) system lets you track your own figures, which is why I think it is more useful day-to-day than any outside benchmark. It records every sale and builds a history you can use as your main comparison tool. By checking your POS dashboard each month, you can spot changes in your cost of sales before they show up on your yearly tax return.
POS also helps you investigate any gap you find against the ATO figures. You can pull reports on gross margin dollars, stock turn, and dead stock by category and supplier to understand exactly what is driving a number. Your POS might reveal that your cards category consistently outperforms your historical average, which is worth expanding on. For more on this, check out our POS reporting guide.
You should begin by getting your own 12-month trends for cost of sales, rent, and total expenses from your POS system and your accountant. This is your main benchmark. Once you understand your own pattern, compare it to the ATO ranges. If you see a gap, that is your cue to look into it further and investigate.
Your Own Numbers First
To sum up, your own figures, tracked over time, are the most important benchmark for your newsagency. The ATO’s latest numbers are still helpful as a second opinion, but they are just a general guide, not a rule made for your business. Use both, rely on your POS system to keep your data accurate, and you will make better decisions than if you use only one source.
Written by:

Bernard Zimmermann is the founding director of POS Solutions, a leading point-of-sale system company with 45 years of industry experience, now retired and seeking new opportunities. He consults with various organisations, from small businesses to large retailers and government institutions. Bernard is passionate about helping companies optimise their operations through innovative POS technology and enabling seamless customer experiences through effective software solutions.