Your Virtual Cashier: Something Worth Thinking About

I was at a retail meeting recently, and the topic that got people talking and thinking was "virtual cashiers." It is already happening in America. Here's how it works: instead of having a cashier standing at your counter, you have a screen. On that screen is a real person, live via video, like Zoom. That person is working in another country, maybe the Philippines or India, but they are is your cashier in your shop.
The setup depends on what kind of business you run.
For Quick-Service Businesses
Say you run a fast-food shop; the virtual cashier works just like a regular cashier. They greet the customer, take the order, enter it into your POS system, and guide the customer to tap their card on the payment terminal. Between customers, they can answer your phone, monitor your security cameras, or handle other tasks.
For Retail Shops
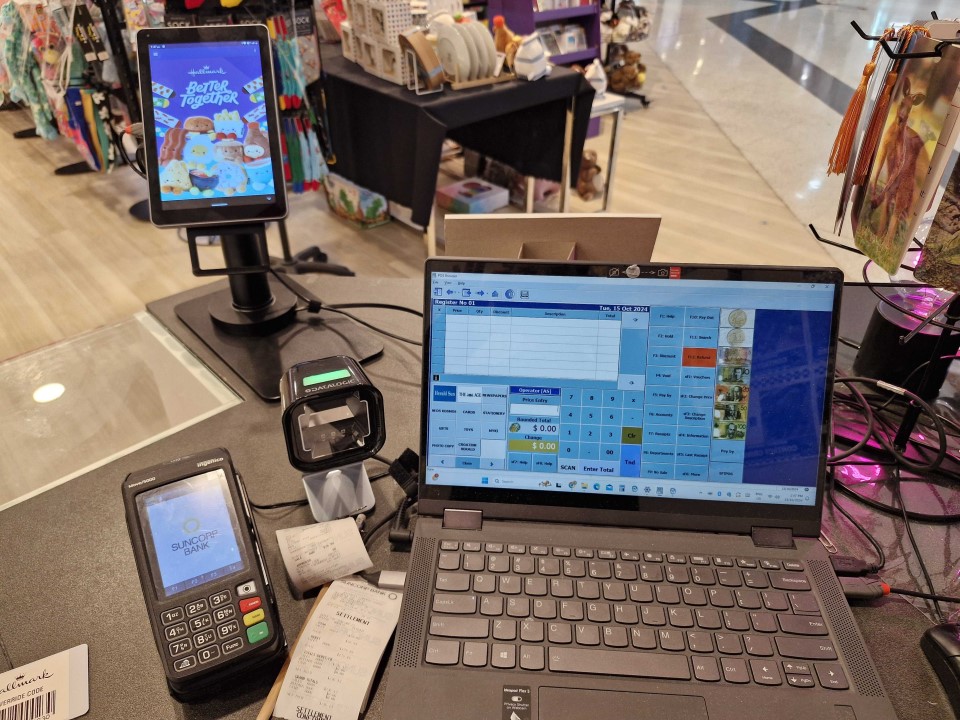
If you run a newsagency, chemist, pet shop, or similar business, it works as a hybrid between self-checkout and a staffed counter. The customer scans their own items with a barcode scanner, while the virtual cashier monitors everything via a camera feed. They can help if a barcode won't scan, handle age verification for tobacco, or answer questions. Most importantly, they watch to make sure everything gets scanned, which will address the biggest problem with self-checkouts: theft. Today, self-checkout theft can be 16 times higher than with traditional cashiers. Some are going back to cashiers, and so few SMB retailers are rejecting them.
The Money Side of Things
Let me be blunt about the costs.
Right now, if you employ a casual cashier in Australia, you're paying around $27 per hour base rate, plus often casual loading. Then there's superannuation at 11.5%. And weekends? That's when it really hurts: 150% on Saturdays and 175% on Sundays. If you're open seven days a week, 12 hours a day, you're looking at over $85,000 a year for one full-time cashier position.
Now compare that to virtual cashier rates. Even if you're paying double or triple the local rate in India or Pakistan, you're looking at $6 to $9 an hour. That is a potential savings of $60,000 or more per year, per position. It's no wonder that so many were interested in the retail meeting.
As a virtual cashier watches the transaction through a camera, another major cost-saving is theft, since the customer knows someone is watching. They can't "accidentally" forget to scan items, and it's harder to swap barcodes, the banana trick where people swap a barcode on a cheaper item onto a dearer one..
What would be needed to set it up?
When we thought it through, it did not seem as complicated as it might sound.
- Professional remote desktop software so the virtual cashier can control your POS system
- A monitor facing the customer showing the cashier's video feed
- At least two cameras, one pointed at the customer, and the other at the scanning area
- Good quality microphone and speakers for a clear two-way conversation
- Reliable, fast internet (this is not negotiable; it would need to be business-grade, not home broadband)
- Recording capability for any disputes or investigations
- We could easily make it better with our AI
So yes, there's an upfront cost for this equipment, but when you're saving $60,000 a year, it's minor.
I am sure we could do it right now with some of our clients.
Will Customers Accept This?
This is the $60,000 question?
Here's what we know: Australians already use self-service checkouts. A friendly face on a screen is actually more personal than such machines. Today, in call centres, customers call businesses every day and speak to someone overseas, often without even knowing it. I know a medical clinic that uses remote receptionists in India. These receptionists book appointments through the practice software.
According to reports in the USA, early feedback from places using these virtual cashiers is mixed: some do not like them, while others say their customers do.
Things to Consider
It's worth thinking about.
I'm not going to pretend this is a perfect solution, nothing is, and there are legitimate concerns, but the reality is that your retail margins are tight and getting tighter. Labour costs keep going up. Theft keeps eating into your profits and your customers are increasingly comfortable with technology.
Now ask yourself what matters most to your customers? The lowest price, or a local person behind the counter? My gut feeling is that most will vote with their wallets.
Written by:

Bernard Zimmermann is the founding director of POS Solutions, a leading point-of-sale system company with 45 years of industry experience, now retired and seeking new opportunities. He consults with various organisations, from small businesses to large retailers and government institutions. Bernard is passionate about helping companies optimise their operations through innovative POS technology and enabling seamless customer experiences through effective software solutions.


