Point of Sale Software

Here are some Articles from the Blog Subject - Retail Analytics -

Negative Stock (Inventory): How to Find your Stock Discrepancies Fast

POS SOFTWARE

What to do about negative stock in retail


Negative inventory, also known as negative stock, is when your system shows that item quantities are negative. For SMB retailers, this is a warning sign of serious inventory management issues that need immediate attention. Every instance points to deeper problems in your POS system. If not fixed, this negative stock can quickly lead to significant issues.

Understanding the causes of negative stock is a first step toward resolving these discrepancies.

Understanding negative stock

When your records display negative stock, your stock quantities information is unreliable, making it difficult to make informed business decisions. As a result, staff may lose trust in the POS system and hesitate to rely on its information. If the staff start to realise that your controls are weak, it can be disastrous as it invites staff theft.

Additionally, negative inventory distorts sales, purchasing, and financial reports, making it more difficult to analyse performance.

Beyond data reliability, negative inventory also disrupts key business reports.

Causes of Negative Inventory and How to Prevent Them

Negative stock usually results from a mix of factors. -Delays in processing supplier invoices (leading to sales before stock is entered into the POS System) -Errors in supplier invoices -Staff entering incorrect quantities.

Fortunately, some preventative measures can help minimise these inventory incidents.

Preventing negative inventory starts with robust staff training. Ensuring your team understands correct inventory procedures and that you consider it essential to do accurate data entry. Checking carefully that suppliers' electronic invoices match the deliveries. Implementing barcode scanning for both receiving and selling stock significantly reduces manual entry errors.

Financial and Customer Service Consequences

Negative stock can have significant financial consequences, as it distorts your KPIs and leads to incorrect calculations of the cost of goods sold (COGS) and profit margins.

Possibly the biggest problem is that it will result in inaccurate GST tax reporting.

From a customer service perspective, negative inventory can lead to lost sales and a poor customer experience, as the computer indicates that you do not have stock when, in fact, you do have the stock the customer is looking for to buy.

Detecting and Correcting Negative Inventory

To address negative inventory, use your POS system to run reports like 'Quantity On Hand' or 'Price Check.' It is easier to do it one department at a time rather than the whole shop at once. Items with negative quantities are clearly shown. Please investigate each case to identify whether the cause is a counting error, data entry mistake, or delayed invoice.

These financial inaccuracies also impact customer service in tangible ways.

Finding the negative stock

Fortunately, we have a quick and easy way to check stock quantities for what you have on hand.
 
Go to reports. There is an option for Quantity On Hand and Price check; click on that.


POS Software menu


We exclude items with zero stock. 
 
I suggest doing it by department, so in this example, I picked the dissection (department) tobacco. 
 

POS Software On hand and preice options


Now, in the outcomes report, which lists the details of your item, look at the quantities on hand in the QOH column. You may see items in brackets, as indicated by the green arrow below; these are the negative Stock Discrepancies.


At first, you will find it a lot of work to fix it, but once done, it's relatively quick.

You should frequently check this report for negative stock values, say monthly until the problem is fixed.

Now, audit these negative items to determine what went wrong in your inventory management system.


Inventory Adjustment Best Practices

After completing a stocktake, your inventory figures are at their most accurate. So it is the ideal time to review and correct any discrepancies.

When making inventory adjustments, it is a good idea to determine the reason for each correction. It can reduce the problem in the future.

Real-World Example: The Cost of Negative Inventory

A staff member mistakenly told a customer that the item was out of stock when it was actually in stock. It led to a lost sale for the business. When the staff member saw they had the jumpers, they reported this to the owner. What she found was a negative quantity for a popular jumper. However, upon investigation, they discovered that they had not entered a recent delivery invoice.

Empowering Your Retail Business

With proactive prevention and early detection, negative inventory can be handled by utilising tools like our reports to stay informed about your stock quantities.

Only by understanding the causes can you fix the problem.

Let us know if you have any other questions!

*This article draws on industry best practices and current expert recommendations to help SMB retailers understand and tackle negative inventory.

Written by:

Bernard Zimmermann


Bernard Zimmermann is the founding director of POS Solutions, a leading point-of-sale system company with 45 years of industry experience, now retired and seeking new opportunities. He consults with various organisations, from small businesses to large retailers and government institutions. Bernard is passionate about helping companies optimise their operations through innovative POS technology and enabling seamless customer experiences through effective software solutions.


Add new comment

Restricted HTML

  • Allowed HTML tags: <a href hreflang> <em> <strong> <cite> <blockquote cite> <code> <ul type> <ol start type> <li> <dl> <dt> <dd> <h2 id> <h3 id> <h4 id> <h5 id> <h6 id>
  • Lines and paragraphs break automatically.
  • Web page addresses and email addresses turn into links automatically.
CAPTCHA This question is for testing whether or not you are a human visitor and to prevent automated spam submissions. Image CAPTCHA
Enter the characters shown in the image.

How to do a margins review now

POS SOFTWARE

retail profit margin management

Maintaining a healthy retail profit margin is more crucial today as everything is changing now. Suppliers are adjusting prices that were artificially kept low during the COVID-19 pandemic. Additionally, with inflation, higher hidden taxation, and persistently high interest rates, SMB retailers are facing increased costs, which is causing erosion of their profits.

Why Margins Matter

A margin is the difference between your cost and selling price. Any drop will have an impact on your profitability.

How to Review and Track Margins Effectively

Establishing a Proactive Margin Review Process

Margin protection starts with how often and how thoroughly you review your numbers. Relying solely on ad-hoc checks from time to time is a dangerous approach. With a POS system, it is easy and quick to do so. Why not schedule a monthly margin review for your shop? This will allow you to identify pressures early and take corrective action before profits slip away.

Leveraging POS Technology for Margin Protection

Modern POS systems can simplify margin management. For example, reports like “Quantity On Hand and Price Check” display your margins in a clear, list format. Use this report to identify low-margin items quickly. Then ask yourself why they’re so low.

I find it better to do it department by department.

Regularly reviewing this report empowers you to take timely action and protect your profit margins.

Ready to Protect Your Retail Profit Margin?

First, you must look into your business and run the numbers.

Now I suggest you run "Quantity On Hand and Price Check" report.

This shows your margins. It makes it quicker to check as it is in a list.

Benchmarking: Stay Competitive

Don’t operate in isolation. Checking your figures against those of similar retailers in your area can also be a helpful exercise. If your prices deviate significantly, you need to investigate. A quick walk around the area, plus a study on the internet, can tell you what you need to know.

Action Steps for Retailers

Achieving sustained profitability in retail requires a continuous commitment to margin management. Here’s how to get started:

  • Set a regular monthly review schedule
  • Leverage your POS technology, have you set up automatic margin tracking
  • Review pricing and promotions
  • Compare your performance to industry standards.


Improving your profit margins was good, but it's necessary now.

Written by:

Bernard Zimmermann


Bernard Zimmermann is the founding director of POS Solutions, a leading point-of-sale system company with 45 years of industry experience, now retired and seeking new opportunities. He consults with various organisations, from small businesses to large retailers and government institutions. Bernard is passionate about helping companies optimise their operations through innovative POS technology and enabling seamless customer experiences through effective software solutions.


Add new comment

Restricted HTML

  • Allowed HTML tags: <a href hreflang> <em> <strong> <cite> <blockquote cite> <code> <ul type> <ol start type> <li> <dl> <dt> <dd> <h2 id> <h3 id> <h4 id> <h5 id> <h6 id>
  • Lines and paragraphs break automatically.
  • Web page addresses and email addresses turn into links automatically.
CAPTCHA This question is for testing whether or not you are a human visitor and to prevent automated spam submissions. Image CAPTCHA
Enter the characters shown in the image.

AI analysis limitations in retail

POS SOFTWARE

AI analysising of a retail shop

Australian retailers are today exploring AI-powered POS analysis to gain deeper insights from their POS system reports. While AI offers substantial potential, it is crucial to understand its current limitations, especially when integrating it with POS system analytics in today's business.

What I would like to discuss is the issue of utilising the information in your POS System to drive an AI analysis. It is something that my company was one of the first to explore with OpenAI, the creators of what is now ChatGPT, years ago.

Data Quality and System Integration

Like any advice, the effectiveness of AI-driven POS analytics depends on the quality and completeness of the information we give it. If the information you feed it has errors, then I doubt analysis will help. That is why a manual review of the information you are feeding the AI is so critical. It is also why many are saying that now is the best time to utilise AI to review your stock, as the information in your POS System has been verified during the stocktake you have just completed.

These data challenges lay the groundwork for further issues, such as the risk of AI hallucinations, which we explore next.

Hallucinations

Hallucinations are not just an AI problem. In human conversation, topics often drift, leading to another topic. AI can behave similarly, sometimes producing nonsensical or, worse, convincing but incorrect results.

The significant issue here, at worst, is that the AI has said something so convincing that it's difficult to dispute its accuracy. Our clients have sent me such examples.

In contrast, programmers audit traditional POS system reports, which are based directly on actual transaction data and clients' stated needs. It provides you with focused information on the real needs of the business and greater reliability for informed business decisions. An example is a report generated by an AI system, Perlexity, that incorrectly identified a non-existent sales trend a newsagent sent me. If the newsagent had listened to it, they would have ordered a lot of unsellable stock.

Local Market Dynamics

AI systems often lack a sophisticated understanding of local market conditions, regulatory requirements, and cultural factors that significantly impact Australian retail operations. This limitation becomes evident when AI tools recommend a strategy to one of our clients based on an American holiday or season that is of minor significance in Australia. A classic example, which I recently discussed here, was a gardening tip from the US, where the seasons are reversed. An excellent tip for gardening in spring is of little use to an Australian retailer in autumn. 

When you ask an AI for advice, you have, like any other advisor, to tell it of what we call localisation issues that your shop faces. For example, say you are a pet supplier. There is a significant difference in the advice someone would give you if you are a large retailer with a small department for pet supplies or a small business exclusive pet retailer. Before asking for advice, specify as much as possible; for example, it's better to say, rather than

"What can you tell me I should do based on this information?"

say

"My Pet Shop is in the Dingley Village Shopping Centre, which is a well-established neighbourhood retail hub anchored by Woolworths, which generates steady daily foot traffic and creates strong cross-shopping opportunities for specialty stores like my pet shop. The centre's tenant mix is focused on essential services, making it resilient to economic fluctuations and attractive to the local community, which is characterised by above-average incomes and a family-oriented demographic. While Woolworths' in-store pet section, internet and nearby major pet chains present direct competition, the centre's strong local customer base and consistent visitor flow provide a solid foundation for us.

Now, what can you tell me based on the information from my POS System that I am giving you now?"

I find using AI to create such a summary works well. Once you have it store this description as you will often need it once you start analysing with AI. Many AIs allow you to make a character for your shop. I will discuss this more in another post.

The information you get now is much more relevant.

Transparency of the advice

Due to the way AI operates, it's often impossible to follow the reasoning. We call it a "Black Box". We know what we put in, and we see what we get out, but how does it go from in to out? Most of us, if we do not understand the logic, are reluctant to use it, and with the hallucination issue, it may be dangerous to follow its advice.

Historical Patterns

What I love about AI is that it's terrific at finding incredible patterns in your information. Still, it can struggle to adapt quickly to sudden market changes or unprecedented events that it is not aware of. Retail markets often change rapidly, requiring immediate strategic adjustments.

What you need to do here is tell the AI when this happens.

"redo as what you should have taken into account ....blaa blaa blaa........".

Like any advisor, you often need to give them another go if they get it wrong.

AI often requires multiple attempts to achieve satisfactory results.

Technical Implementation and Operational Requirements

Successfully utilising AI analytics for POS data requires some practice to build up your technical expertise. It's not hard, but like most things, it does take some practice. The more you use it, the better results you will get and the more you will get out of it.

Please, based on my experience, the most reliable way to feed your POS data into an AI tool is by exporting reports as Excel or CSV files. Excel is better, but some AIs do not like it. If so, use CSV. Both provide a standardised format that the AI is designed to process. When you supply your information, do not simply import your existing reports to get quality insights. The less you ask the AI to guess, the better.

Creating an Excel or CSV file is simple in our POS System. From any report, press the red arrow.


However, most POS Systems can export your reports into Excel or CSV.

Use Excel or CSV, not the report, which often invites trouble. 

Actionable information

Having extensive volumes of information is rarely much use; what we need are actionable insights. Many experience that when this happens, paralysis reduces decision-making efficiency rather than enhancing it. What I suggest you do is, if the AI does this, ask it, "What actionable steps that directly support our business objectives and operational improvements can you make from this?"

The Essential Role of Your Expertise

For AI today, human judgment is essential. It's your business, your livelihood and ultimately your decision. It's crucial to double-check before making business decisions.

How to use AI for Retail

The key to successful AI implementation lies in viewing its limitations as opportunities for strategic improvement. Retailers who set realistic expectations and thoroughly validate can gain advantages while ensuring operational reliability.

AI is brilliant, but you need to be thinking too.

Written by:

Bernard Zimmermann


Bernard Zimmermann is the founding director of POS Solutions, a leading point-of-sale system company with 45 years of industry experience, now retired and seeking new opportunities. He consults with various organisations, from small businesses to large retailers and government institutions. Bernard is passionate about helping companies optimise their operations through innovative POS technology and enabling seamless customer experiences through effective software solutions.


Add new comment

Restricted HTML

  • Allowed HTML tags: <a href hreflang> <em> <strong> <cite> <blockquote cite> <code> <ul type> <ol start type> <li> <dl> <dt> <dd> <h2 id> <h3 id> <h4 id> <h5 id> <h6 id>
  • Lines and paragraphs break automatically.
  • Web page addresses and email addresses turn into links automatically.
CAPTCHA This question is for testing whether or not you are a human visitor and to prevent automated spam submissions. Image CAPTCHA
Enter the characters shown in the image.

Determine your Shrinkage and Damaged rates for your shop

POS SOFTWARE

How to Calculate Inventory Shrinkage and Damaged Goods: 2025 Guide for Australian Retailers

Inventory shrinkage and damaged goods continue to rapidly erode profitability for Australian retailers, making retail loss prevention an increasingly important priority. With your latest stocktake complete, now is the ideal time to calculate these critical rates, as you will never have better figures. Good inventory control transforms a retail business.

Inventory Shrinkage and Damaged Goods

Let's define what we are talking about first. Inventory shrinkage refers to the loss of stock that occurs when actual inventory levels are lower than what your computer records indicate, which we refer to as the perpetual stock. Common causes of losses include theft, administrative errors, and other similar issues.

Goods that, due to damage, cannot be sold at full price are classified as damaged goods.

Calculating your Inventory Shrinkage rate

To accurately determine your inventory shrinkage rate, follow this process that leverages your POS system's inventory management tools.

Begin by establishing your perpetual stock value. This figure represents your theoretical inventory level, as reported by your POS software, before any physical stocktake.

Now you have the physical stocktake that you have just done.

In our POS system, we have a comparison report that automatically provides the figures for losses. Focus exclusively on products physically carried in your store, excluding non-stock sales such as lottery tickets or service revenue, to ensure the calculation accurately reflects inventory movement. We can do something similar with your lotto system, as lotto does have a report of what you should have sold. I will address this in a separate post.

The shrinkage formula is as follows:

=(Perpetual Stock Value) - (Physically Counted Inventory Value)/(Perpetual Stock Value) x 100%

Example

A retailer with a perpetual stock value of $100,000 in a department finds, after the stocktake, that their stock is $98,500, and sales of stock products total $70,000 for the period. The shrinkage rate would be:

=(100,000 - 98,500)/100,000 x 100 = 1.5%

This calculation shows that 1.5% of the stock was lost to shrinkage. That rate, unfortunately, is not uncommon. Some of you may be surprised by how high your figures are. Shrinkage rates have increased this year. They increased the previous year as well.

Industry Benchmark for 2025

The retail shrinkage rate for Australian retailers is about 1.4%.

Every 1% shrinkage causes about a 3.5% drop in profit.

A rate above 2% highlights the need for immediate investigation and remedial action.

Calculating Damaged Goods

The calculation for damaged goods is as follows:

=(Damage Stock Value)/(Cost of Stock Product) x 100%

We refer to this as the damage rate, another significant contributor to inventory loss. These damaged goods cannot be sold at full price.

Looking at them, we can often determine the cause.

Inventory Management and Loss Prevention Strategies

Effective inventory management is crucial for minimising both shrinkage and damaged goods. Analysing losses by category, department, or location allows you to pinpoint where problems are occurring. Recording the reasons for missing or damaged items—such as theft, receiving errors, or poor storage—provides actionable insights for process improvement.

With a modern POS inventory management system, you at least have real-time tracking of the problem.

Conclusion

After determining the overall measurements of your inventory shrinkage and damaged goods, you may want to dive deeper into specific departments by performing this analysis across departments, as well as consider doing it by key items and locations. Using this, you can pinpoint areas of concern. 

Written by:

Bernard Zimmermann


Bernard Zimmermann is the founding director of POS Solutions, a leading point-of-sale system company with 45 years of industry experience, now retired and seeking new opportunities. He consults with various organisations, from small businesses to large retailers and government institutions. Bernard is passionate about helping companies optimise their operations through innovative POS technology and enabling seamless customer experiences through effective software solutions.


Add new comment

Restricted HTML

  • Allowed HTML tags: <a href hreflang> <em> <strong> <cite> <blockquote cite> <code> <ul type> <ol start type> <li> <dl> <dt> <dd> <h2 id> <h3 id> <h4 id> <h5 id> <h6 id>
  • Lines and paragraphs break automatically.
  • Web page addresses and email addresses turn into links automatically.
CAPTCHA This question is for testing whether or not you are a human visitor and to prevent automated spam submissions. Image CAPTCHA
Enter the characters shown in the image.

AI Reporting vs POS Systems reporting today

POS SOFTWARE

AI reports vs POS Systems reports


Today, AI-driven POS Systems are revolutionising the information flow to retailers. AI reporting offers advanced analytics and predictive insights compared to traditional POS system reporting. I love its ability to allow users to ask questions and research topics, enabling us to make more informed business decisions. Train your model with your information, and ask questions. If you do not understand something, you can ask for more information. It is brilliant. If anyone wants to attend a webinar on these functions, let me know.

While AI-powered analytics often deliver revolutionary insights, most users usually do not need them. Many retailers find that traditional POS reporting provides the information required for day-to-day business operations, which remains today's cornerstone of retail reporting.

The Trust Advantage of POS System Reporting

In business, POS systems have been refined over the decades, offering reporting functionality that captures actual transactions. Almost all errors have been worked out of the system, so retailers can confidently use this information to make business decisions.

The challenge with AI reporting systems lies in "hallucinations". These occur when the AI often generates plausible but factually incorrect information. Recent evaluations of advanced AI systems indicate hallucination rates of about 1.1% on simple tasks, and I have seen figures of 30-50% in complex tasks reported. What happens is that the AI, when asking your question, goes off track. It then moves along this track into nonsense. What is dangerous is that sometimes it appears plausible and can be hard to spot. It creates significant risks for retailers who might make substantial decisions based on inaccurate analysis. While doing a study, a pet shop retailer in Brisbane considered increasing its stock levels in dog toys based on an AI report trend. That trend did not exist. If they had followed it, they could have brought much excess inventory. Luckily, they picked it up. By contrast, when a POS system shows a 24-month history of a product sold, that figure represents a real figure.

Operational Speed and Accessibility

Timing becomes critical in retail environments where rapid decision-making directly affects sales outcomes. Our modern POS systems generate comprehensive reports within seconds for free. The system does not require an internet connection or an AI subscription.

Industry-Specific Relevance for Australian Retail

POS systems are designed specifically for retail operations. It incorporates Australian terminology and KPIs that align directly with Australian business practices. Standard POS reports include daily sales summaries, staff performance metrics, inventory turnover rates, and GST calculations, all of which conform to Australian requirements. An AI report, while powerful, often struggles with Australian-specific requirements. We have noticed that an AI analysis usually uses international accounting terminology that requires translation. When doing the report, we must do Google searches to determine what is being said. I have discussed this problem in depth here when we ran 100s of AI reports. 

Security and Compliance for Australian Businesses

We have a big problem here, as much of the information in your POS System is restricted. For example, in Australia, we have strict privacy laws. Your POS systems incorporate security features specifically designed for this retail environment. These security measures have evolved over many years and are focused on retail-specific security requirements. Using AI for business reporting typically involves transmitting all your business data to third-party cloud services, raising concerns regarding data storage locations, retention policies, and potential use of proprietary business information. More dangerous is that all your information can be accessed by people in your organisation. Its hard to restrict parts of your payroll information so some of your staff might get what others earn. 

Transparency in Reporting Methodology

When a POS system identifies top-selling products, the calculation methods are transparent and verifiable. You can do the calculation manually to figure out how it works. If the results appear unusual, you can easily check the report. This transparency builds confidence in the process.

AI-generated reports generally suffer from what we call "the black box problem." We get a result, but no one knows the reasoning behind its recommendations, making it difficult for anyone to understand the findings.

Consistent Reporting Over Time

POS reporting remains consistent over time. Once a retailer masters it, they know how to use it, what it gives them, and how to make meaningful comparisons over time.

AI systems face challenges with what we call "model drift." When you do the same thing, use the same prompts, you probably get different responses, each run of a report gives a different answer.Each run is an experiment. 

When to Use Each Reporting Type

The clear advantages of traditional POS reporting for day-to-day retail operations, POS reporting excels in managing daily operations, staff performance evaluation, inventory control, cash flow monitoring, tax compliance, and comparative performance analysis. These functions form the operational backbone of Australian retail businesses.

I like to think of AI reporting as going to see an expert. They often have great knowledge in a particular area of your business and can help you examine the situation. They can tell you about subtle patterns in the industry and what is likely to happen, giving you insights, but you need to be very careful about accepting their advice without further thought. What we love is its ability to allow you to ask questions and explore.

Implementation Recommendations for Australian Retailers

For Australian retailers considering their reporting, you need a robust POS System that provides the fundamental business metrics.

When evaluating AI tools, take their advice with a grain of salt. We expect that in ten years, AI reporting will take over, but not yet. We are all experimenting with it. Its a lot of fun but think of it as science experiment.


Written by:

Bernard Zimmermann


Bernard Zimmermann is the founding director at POS Solutions, a leading point-of-sale system company with 45 years of industry experience. He consults to various organisations, from small businesses to large retailers and government institutions. Bernard is passionate about helping companies optimise their operations through innovative POS technology and enabling seamless customer experiences through effective software solutions.


Add new comment

Restricted HTML

  • Allowed HTML tags: <a href hreflang> <em> <strong> <cite> <blockquote cite> <code> <ul type> <ol start type> <li> <dl> <dt> <dd> <h2 id> <h3 id> <h4 id> <h5 id> <h6 id>
  • Lines and paragraphs break automatically.
  • Web page addresses and email addresses turn into links automatically.
CAPTCHA This question is for testing whether or not you are a human visitor and to prevent automated spam submissions. Image CAPTCHA
Enter the characters shown in the image.

Best Free AI for Analysing Your Customers

POS SOFTWARE

AI data processing in retail


One of AI's great promises is to take data and produce advanced information. The problem is that today, we have too much information that is hard to process; it's just too much. So, let's see what happens when we take real point-of-sale software data and put this promise to the test.

So, we decided to test the AI's understanding of a typical SMB retail shop from its customer's sales report. Knowing your customers is essential for retail success, and we will check whether an AI customer data analysis can help us make informed decisions about them.

The added question is which free AI tools can perform this task most effectively. Only a few SMB retailers have paid accounts for AI ChatBots, so we decided to restrict our tests to the free version. As you will see, we immediately ran into problems with this during this test.

Okay, let's test that and see.

Our Test

We have already established a comprehensive evaluation process to determine which AI systems deliver the most actionable insights here.

So, we challenged six leading free AI systems to analyse real customer sales performance data from 2023 and 2024.

Each AI system received identical instructions: "Using data from the attached CSV files, analyse and compare sales performance and visit frequency for top customers in an Australian Newsagency between 2023 and 2024. Identify key changes in behaviour for the highest-value customers."

For a fair assessment, we evaluated each system's customer analysis report using nine key performance indicators and scored out of 10:

Evaluation Framework

Quality of Information

How accurate was the data presented about customer behaviour and trends? If it's not correct, it's worse than useless.

Usefulness

Do these insights improve a retail business? We do not need useless information.

Clarity

Was the analysis presented straightforwardly and clearly?

Actionability

Did the report provide clear, implementable recommendations?

Accuracy

Were the calculations and conclusions drawn from the data correct? AI is known for giving wrong results. This is a common problem of AIs.

Adaptability

Did the analysis take into account specific retail contexts and customer demographics?

Depth of Analysis

Did the report go beyond surface-level observations to uncover meaningful patterns?

Creativity

Were there innovative suggestions for addressing the identified changes in customer behaviour?

Customer-Centric Approach

Did the analysis effectively segment customers and provide tailored approaches?

Testing Limitations

Unlike our pricing study, we encountered several practical limitations with free AI access immediately:

Claude and Chatgpt required paid accounts to process our instructions, so they failed the free test. However, as they are very important AI chatbots, we decided to test them with our paid accounts, but they failed immediately.

QWEN would only process our prompt by editing it in the window's notebook, so we had to redo the tests with consolidated data. Doing this with QWEN requires some computer skills, which others do not need. We marked it down for this.

All the other AI systems could process our request without issue using their free tier offerings.

Immediately, we saw that when we analysed the solutions, not all of them offered the same ability.

Results Summary

The performance rankings revealed interesting shifts from our previous pricing analysis:

AI Tool Score (out of 90)
ChatGPT 78
Grok 68
DEEPSEEK 67
QWEN  66 (marked down)
Claude 59 (failed)
Google AI 55

Interestingly, while Google AI topped our previous pricing study, it ranked last for customer analysis.

Detailed Analysis of Each AI Tool

ChatGPT (Score: 78/90)

On the paid version, and I stress the paid-only

Strengths

  • We thought it showed exceptional clarity. The report was well-organised, with sections in a logical progression We liked its innovative customer segmentation framework, which includes categories like "Growth Champions" and "Frequent Shoppers."
  • We all liked its analysis and felt it was comprehensive
  • What we liked was its tailored recommendations for different customer segments

Problems

  • There was nothing we thought was innovative, but it worked by the rules. It ignored the location, that we were in Australia, and the same problem we had in the previous test.

Overall

ChatGPT transformed customer data into strategically actionable segments that you can use in your marketing and sales approaches. It saved time but gave us little originality.

Grok (Score: 68/90)

Since it's now free, this is a brilliant AI. You should be delighted with it.

Strengths

  • We notice that it is outstanding in its accuracy and attention to detail
  • The report was an in-depth and comprehensive analysis
  • We liked its comparative analysis of individual customers
  • It came up with a category, and we liked the emerging high-value customers

Problems

  • We thought that most of the insights were limited in actionability; it's nice to know something, but what is the point of telling us if you cannot use it?
  • Also limited in creative solutions
  • The report sections did not follow a logical order.

Overall

Grok provided an excellent analysis and identified some subtle patterns in customer behaviour. It would be good to investigate why, though you'll need to develop action plans based on its findings.

DEEPSEEK (Score: 67/90)

Strengths

  • Excellent formatting and visual emphasis that make your information accessible
  • We liked that it had specific, implementable recommendations tied to analysis findings.
  • It was accurate in its data presentation, with correctly identified trends
  • Effective customer segmentation approaches

Problems

  • Did not give a detailed customer-by-customer examination
  • Not that good in a specific Australian retail context
  • Recommendations were sound but somewhat conventional

Overall

DEEPSEEK struck a good balance between analytical depth and practical recommendations.

QWEN (Score: 66/90)

Do not underestimate this AI. The only reason it did not win was that it required some advanced computer skills to use. It was not just a simple matter of using it. 

Strengths

  • We liked its brevity, which offered highly actionable recommendations
  • We liked its concise format, clear headings and bullet points
  • It provided good creative thinking in recommendations for improving customer visits
  • We liked its suggestion for improving a loyalty program and bundling.

Problems

Small report: Now, this may not be a problem for you. Some of us liked that it produced a good condensed report. They felt they did not want a book; the quicker it could be said, the better. I disagreed; I wanted to know as much as possible. Let me know your thoughts on this below. We thought it didn't consider that we were talking about retail.

Overall

Many people like QWEN's concise, action-oriented approach, which provides quick and practical guidance without requiring extensive analysis.

Claude (Score: 59/90)

It was a paid version, yet its score was bad. You expect it to be better if you pay, but you don't get what you pay for with AI.

Strengths

  • It provided accurate data analysis throughout
  • We did like its breakdowns of top customers and their performance changes
  • It had clear section headings and a well-organised structure
  • It identified key account growth opportunities
  • It also identified at-risk relationships

Problems

  • Overall, it lacked specific implementation strategies
  • The segmentation of customer types was bad.
  • Again, as with some others, not much is known about Australian retail
  • Report sections varied in detail

Overall

Claude was solid but struggled to translate those insights into tailored, implementable recommendations.

Google AI (Score: 55/90)

Now, Google AI is a good AI. Last time, it came out the best, but here, it's the worst. Google changed the free version because it wants you to switch to the paid version.

Strengths

  • Methodical approach to analysis
  • Accurate calculations
  • We thought that it produced logically sound conclusions
  • It considered many factors

Problems

  • It presented an analysis without any specific recommendations
  • Little creative
  • Minimal segmentation of customer types
  • Limited adaptation to retail

Overall

The free Google AI fell short of providing the strategic interpretation and actionable guidance that retailers need.

Key Findings and Implications for Your Retail Business

Our evaluation revealed several important considerations for using AI:

Different tools excel at different retail tasks

It's all good to analyse, but an ideal AI solution should connect the dots between "what's happening," "why it's happening," and, most importantly, "what to do about it." Not all AI ChatBots are equal.

The significant shift in rankings between our pricing study, where Google AI dominated, and this customer analysis evaluation highlights the critical point that AI is not a one-size-fits-all approach. It also showed that suppliers are moving to a user-paid model.

Usability

Busy retailers need an AI that produces a clear organisation and logical flow.

Practical Recommendations for Australian Retailers

Your specific need

The reality is that different AI systems excel at other tasks. There's no way around it; you need to test which one works better in your circumstances.

Prioritise actionability

Choose AI marketing tools that connect analysis to specific actions you can take. Ask yourself: "What can I do tomorrow based on this information?" If the answer isn't clear, the tool may not be right for your needs.

Provide detailed context

We tested with more specific information about a business, location, and customer base. We did get better results, but that's outside of this test. I would include such information if I were doing it in a shop. Don't assume the AI knows your business environment; even if it does, it can use it.

Verify findings

We found that AI made errors and provided advice that didn't align with business reality. Always check.

Continue with a focused question.

These reports should be considered the start of your analysis. To get more insights, I would ask specific questions about the customer, the segments, loyalty patterns, or purchase frequency. For example, "Which customers decreased their visit frequency in the last quarter?" will yield more actionable results than "Analyse my customers."

Integrating AI Insights with Your POS System

For retailers using our POS systems, connecting AI analysis has tremendous potential. Exporting customer sales data in formats your AI can analyse is easy; you can do this in the report section. I will discuss this in a future post.

The Future of AI

This evaluation demonstrates that AI tools have already reached impressive capabilities. Using them, you can get free access to dedicated data analysts. They offer you access to sophisticated insights previously available only to large organisations.

My thoughts

While it's free, I recommend looking at Grok, our winner.


Written by:

Bernard Zimmermann


Bernard Zimmermann is the founding director at POS Solutions, a leading point-of-sale system company with 45 years of industry experience. He consults to various organisations, from small businesses to large retailers and government institutions. Bernard is passionate about helping companies optimise their operations through innovative POS technology and enabling seamless customer experiences through effective software solutions.


Add new comment

Restricted HTML

  • Allowed HTML tags: <a href hreflang> <em> <strong> <cite> <blockquote cite> <code> <ul type> <ol start type> <li> <dl> <dt> <dd> <h2 id> <h3 id> <h4 id> <h5 id> <h6 id>
  • Lines and paragraphs break automatically.
  • Web page addresses and email addresses turn into links automatically.
CAPTCHA This question is for testing whether or not you are a human visitor and to prevent automated spam submissions. Image CAPTCHA
Enter the characters shown in the image.

How to find old stock

POS SOFTWARE


Old stock refers to stock that has remained unsold for an extended period. This stock will hurt your business.

  • Unsold stock ties up money.
  • Every inch of shelf space in your store is valuable, so old stock prevents you from showcasing stock that sells.
  • Items will lose value just sitting on the shelf.

The first step is to identify the old stock using your advanced point-of-sale (POS) system, as I'll show you here.

Then, we will need to manage it, as it is not going away now.

How to Identify Old Stock

You can quickly pinpoint this old stock by combining your technology.

Leverage Technology for Better Insights

Modern point-of-sale (POS) systems track and identify old stock. Here's how our POS software can help:

  • Generate reports to identify items with low or no sales over specific periods.
  • Flag seasonal goods that haven't sold after their peak period.
  • Tell you how long each product has been sitting on your shelves.

Pro Tip

We invite you to explore our engaging training video on identifying old stock. Click here for a training video on identifying old stock.

I suggest focusing on one department. Once that is done, proceed to the following department. Make sure you work systematically.

It avoids making you feel overwhelmed.

Look for Patterns in Your Inventory

Sometimes, the issue isn't just individual products but broader trends. Use your POS data to spot patterns such as:

  • Check brands that consistently underperform
  • Price points that don't sell well
  • Categories with high amounts of leftover stock

These insights will help you clear out old inventory and improve your buying decisions moving forward.

What To Do Once You've Found Old Stock

Identifying old stock is only half the battle—you also need a plan to deal with it. Here are some effective strategies:

Repositioning Products

Always try this first; sometimes, all it takes is a little intelligence.

Bundling

My favourite method is to bundle unsellable stock with good-selling stock. Bundle slow-moving items with popular ones to create value packs. For example, pair unsold candles with bestselling home décor items as a gift set. Another example would be a cookbook that has not sold. Put it together with a cookbook that sells well and charges more for the bundle than the cookbook that sells well.

Clearance Sales and Discounts

The traditional method eliminates this by offering discounts to move slow-moving items quickly. A well-promoted clearance sale can attract bargain hunters while freeing your shelves for new products. It works well during the stock-taking season in July, but it's expensive.

Why Your POS System Is Key

A sound POS system doesn't just help you find old stock; it can help prevent it. Our POS software equips you with tools to manage your inventory.

Predictive AI

Why not use the AI built into our software for intelligent ordering? It's free. It does:

Demand Forecasting

Predicting future product demand based on past trends and external variables.

Optimal Reordering

Identifying the best times and quantities for replenishing stock to avoid overstocking or shortages.

Dynamic Adjustments

Continuously updating predictions based on real-time data, ensuring accuracy even in rapidly changing conditions.

Cost Optimization

Reducing holding costs and waste by maintaining just the right amount of inventory.

By leveraging these tools, you'll clear out old stock and avoid over-ordering in the future.

Final Thoughts

Old stock is an inevitable part of retail life—but it doesn't have to hold your business back. With the right strategies and tools, such as a reliable POS system, you can transform dead inventory into an opportunity for growth. Whether freeing up cash flow or creating space for new products, taking action now will set your business up for success.

Ready to manage your inventory effectively? Watch our step-by-step training video (click here) or contact us today for expert support! Don't let old stock weigh you down—start making smarter inventory decisions today!

Written by:

Bernard Zimmermann


Bernard Zimmermann is the founding director at POS Solutions, a leading point-of-sale system company with 45 years of industry experience. He consults to various organisations, from small businesses to large retailers and government institutions. Bernard is passionate about helping companies optimise their operations through innovative POS technology and enabling seamless customer experiences through effective software solutions.


Add new comment

Restricted HTML

  • Allowed HTML tags: <a href hreflang> <em> <strong> <cite> <blockquote cite> <code> <ul type> <ol start type> <li> <dl> <dt> <dd> <h2 id> <h3 id> <h4 id> <h5 id> <h6 id>
  • Lines and paragraphs break automatically.
  • Web page addresses and email addresses turn into links automatically.
CAPTCHA This question is for testing whether or not you are a human visitor and to prevent automated spam submissions. Image CAPTCHA
Enter the characters shown in the image.

Using your POS Software to find your Unsellable Easter Stock

POS SOFTWARE

Easter unsellable stock problem


Easter brings sales, alright, with chocolate bunnies and festive decorations. However, once the holiday ends, retailers are often left with stock that is difficult to sell. It impacts their cash flow, and worse, it has to be stored. Your POS software can help you identify many unsellable items, allowing you to take action before they impact your profits.

Why Seasonal Stock Becomes Unsellable

Seasonal inventory is a double-edged sword. While Easter drives foot traffic, a study of 40 of our clients revealed that approximately a quarter of the seasonal stock often remains unsold after the holiday, becoming dead stock that ties up cash flow and storage space. That is why we decided to address this problem.

Here is what retailers typically do to solve this common retail challenge:

  • Buy a stock for Easter, but it can be sold after Easter.
  • Some can be returned to the supplier
  • Retailers will typically slash prices by 50–70% to clear Easter leftovers, which erodes their profit margins.
  • The rest has to be stored till next year

Fortunately, with our POS Software, retailers have a powerful tool to help them identify and sell this unsellable stock. This tool can help determine the number of items sold during Easter, but it will likely not sell after following this step-by-step procedure.

Step-by-Step Inventory Analysis

Your POS system does more than process sales—it can help identify unsellable items early, allowing you to take action before they impact your finances. Follow these steps:

Use POS Reports Effectively

Leverage Historical Data

Go to Register Reports, which is marked in green, and then select "Stock Sold During Period(a) Not Sold in Period(b)" from the in-stock section.

Now select in stock, "Stock Sold During Period(a) Not Sold in Period(b)"

Go to Register Reports > Stock Analysis > "Stock Sold During Period (a) Not Sold in Period (b)"

Run this report to pinpoint previous unsellable items:

Set Period (a) 01/03/24 – 31/03/24 (Easter)
Set Period (b) 01/04/24 – 40/04/24 (post-Easter lull).

This report will generate a list of items that sold during Easter but had no sales afterwards.

Flag products with year-on-year (YOY) sales declines. I suggest that ≥15% should be marked as high-risk for overstocking.

Easter sales management

A Melbourne newsagency found that plush toys sold 22% slower than the previous year. They cleared 85% of their inventory early by running a pre-Easter flash sale.

Call-to-Action

Don't let unsellable Easter stock weigh down your business! You can use your POS system today to identify slow-moving items early, take decisive action, and refine your strategy for next year's holiday season.

Conclusion

You need to be able to manage their stock effectively. You should use this report to help manage your stock and maximise profits effectively.

Executive summary

> Due to stock that is only available during specific seasons, such as Easter, seasonal holidays can be particularly challenging for retailers.
> Our POS Software can assist you with tracking down unsellable stock 
> This report will provide a list of unsellable products.

Written by:

Bernard Zimmermann


Bernard Zimmermann is the founding director at POS Solutions, a leading point-of-sale system company with 45 years of industry experience. He consults to various organisations, from small businesses to large retailers and government institutions. Bernard is passionate about helping companies optimise their operations through innovative POS technology and enabling seamless customer experiences through effective software solutions.


Add new comment

Restricted HTML

  • Allowed HTML tags: <a href hreflang> <em> <strong> <cite> <blockquote cite> <code> <ul type> <ol start type> <li> <dl> <dt> <dd> <h2 id> <h3 id> <h4 id> <h5 id> <h6 id>
  • Lines and paragraphs break automatically.
  • Web page addresses and email addresses turn into links automatically.
CAPTCHA This question is for testing whether or not you are a human visitor and to prevent automated spam submissions. Image CAPTCHA
Enter the characters shown in the image.

Testing AI you can use for free

POS SOFTWARE

Framework to access AI for retailers need

As a retail consultant, I am excited about how AI can be used to support small—and medium-sized business (SMB) retailers.

We decided to address the problem of receiving too much information today. No one has time to wade through the mountains of reports we are getting, so I decided to test which free AI solution will deliver results for your shop.

We chose free because most SMB retailers are currently experimenting with AI, and as a result, many are utilising free AI solutions. There is no point in testing something few are using.

We extensively evaluated six leading free AI tools to answer this question, testing them against real-world retail reporting scenarios. We made and rated over 200 reports in total. What we discovered might surprise you, but the results certainly did surprise me. This analysis will be helpful and save you a lot of time.

What the test is addressing

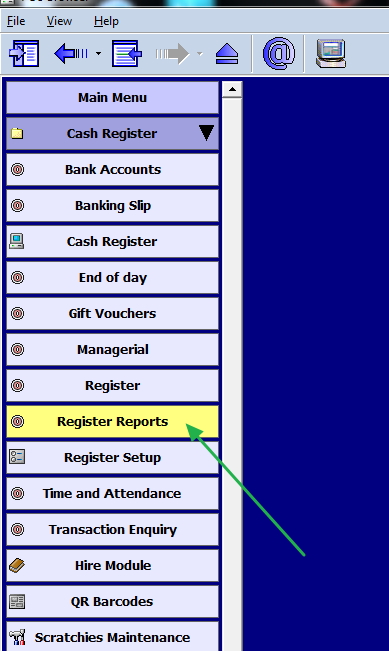
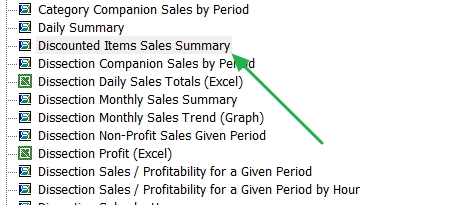
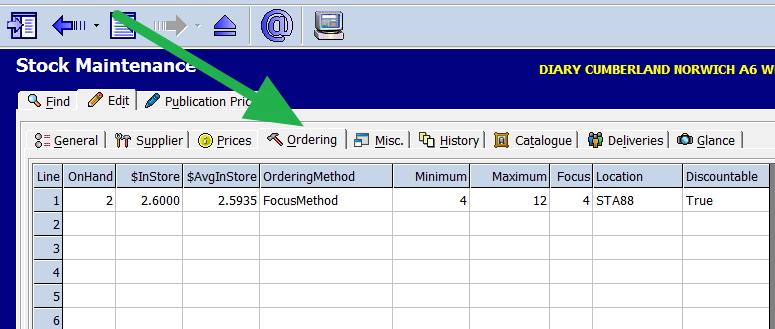
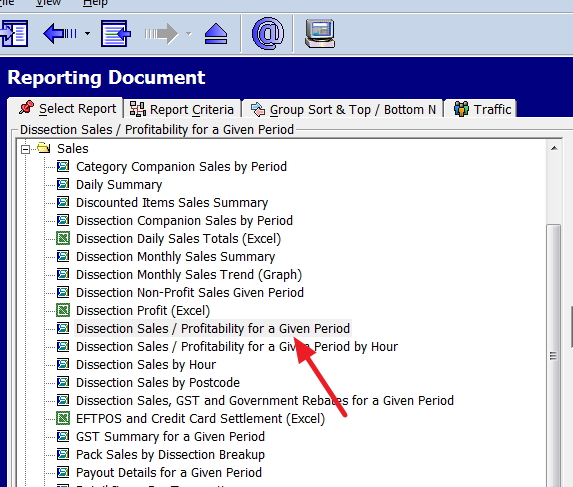
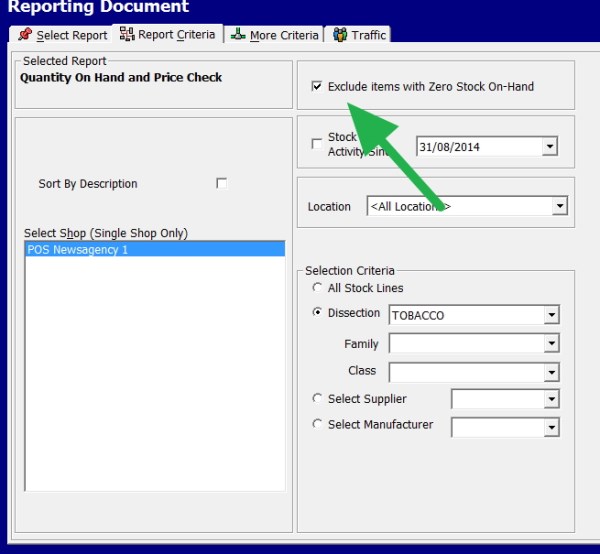
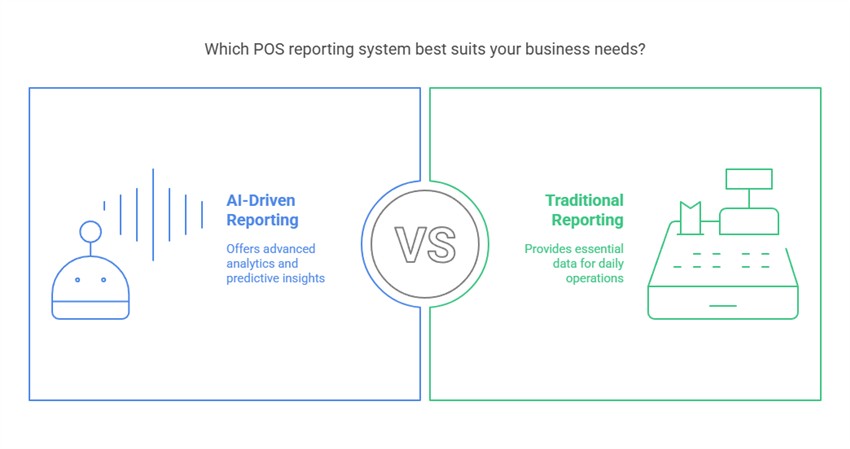
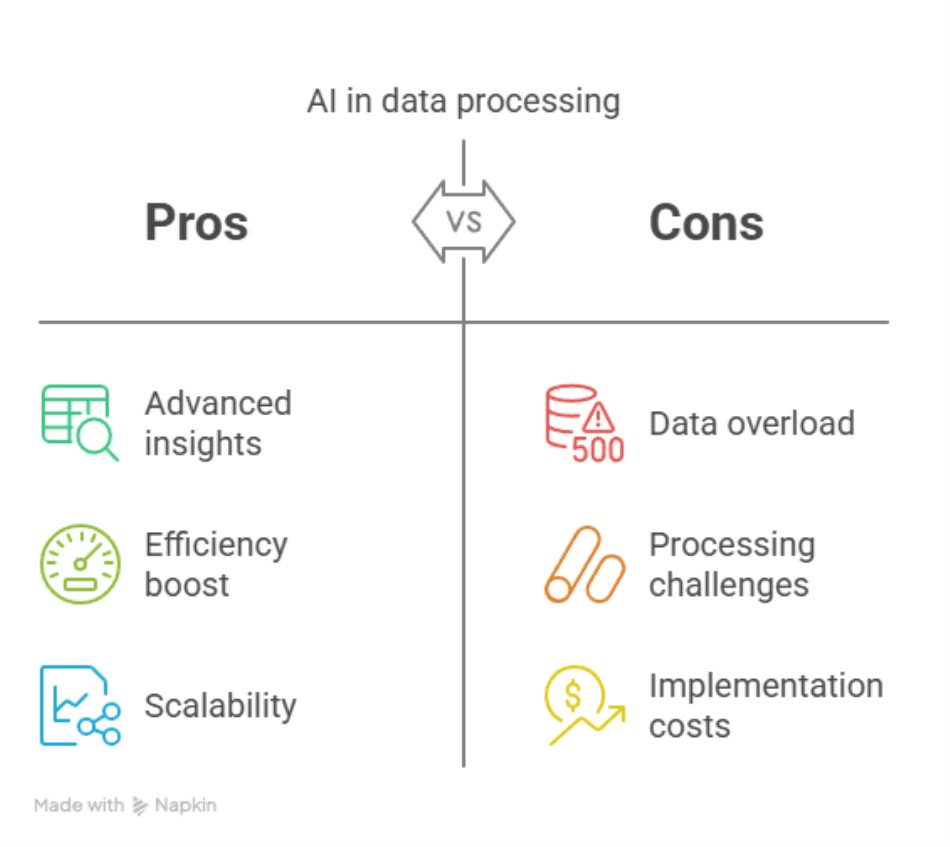
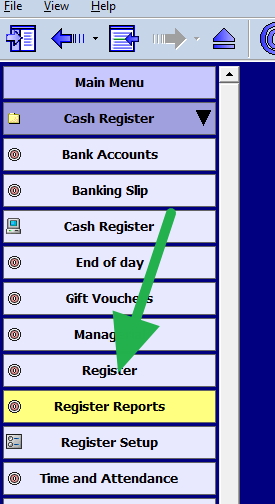
There is a significant gap between the data and the time and knowledge needed to use it effectively. A modern POS system like ours generates hundreds of reports, which require considerable time to review to identify sales patterns, inventory levels, supplier performance, and financial statements. However, finding time to extract meaningful insights from these reports is another matter.

Yet the promise is that AI tools can do this and quickly process reports, identify trends, spot anomalies, and suggest actionable improvements.

The Free AI Landscape

Like so much in the world, not all AI tools are equal; some are better than others, and each one has account limitations.

We tested six popular tools to help you navigate these options:

ChatGPT (OpenAI)

Claude (Anthropic)

DeepSeek

Google AI

Grok 3

Qwen

Evaluation Criteria for AI Tool Performance

Now, we know that all of them are good, but there is always a case where even the best six runners in the world have one who is better, and that is what we wanted to find out: the best free AI for retailers.

Each tool was evaluated on its ability to handle our tests based on these criteria:

Information Accuracy

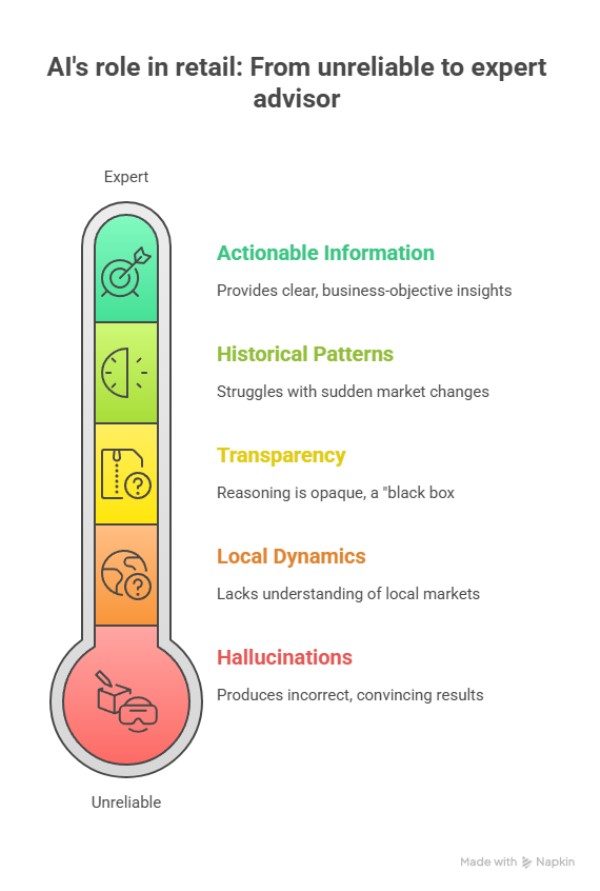
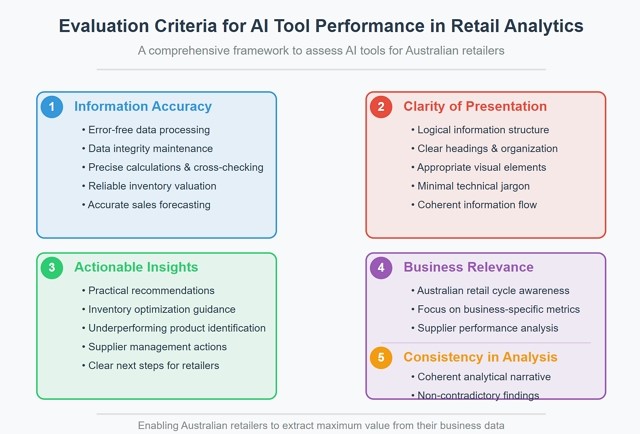
Accuracy formed the cornerstone of our evaluation. Without accurate information, even the most sophisticated analysis becomes worthless for making informed business decisions. We meticulously verified whether each AI tool could process retail data without introducing errors or misinterpreting figures. This involved cross-checking calculations against known values and assessing whether the tools maintained data integrity throughout the analysis. In retail, where margins are often tight, minor inventory valuation or sales forecasting inaccuracies can lead to costly mistakes.

Clarity of Presentation

Accurate information is only valuable if presented in an understandable format. We assessed each tool's ability to structure information logically with clear headings, appropriate visual elements, and a coherent flow that retail managers could easily navigate. We examined whether complex data was transformed into straightforward insights that wouldn't require a data science degree to interpret. A good report should communicate the key points to a retailer without requiring them to wade through jargon.

Actionable Insights

Data without direction offers limited value to retail businesses. We evaluated each tool's ability to convert raw information into practical recommendations that retailers could implement. I am very proud that our POS system provides our customers with tools they can utilise. I want the AI report to do the same. I want to know what specific opportunities were identified in my inventory optimisation, which products are underperforming, and what concrete actions I need to take from my supplier. Good tools should describe what is happening and what should be done next.

Business Relevance

We evaluated each tool's ability to focus on issues that matter most to Australian retailers rather than generic business statistics. Did the AI for example identify seasonal trends in an Australian retail cycles, did it highlight my supplier performance to my business. Information that is not relevant creates noise rather than value.

Consistency in Analysis

Consistency in reporting is crucial for tracking performance over time and making reliable comparisons. We examined whether each AI tool maintained a consistent approach to analysis in its report and whether its outputs provided a coherent narrative. We do not want contradictory findings. Retailers need to trust that the insights they receive follow logical patterns and don't send them in conflicting directions. Inconsistent analysis can lead to confused decision-making and undermine confidence in the technology itself.

This comprehensive evaluation framework enabled us to assess each AI tool beyond its surface capabilities, focusing instead on how effectively it would serve the practical needs of Australian retailers wanting to extract value from their business data.

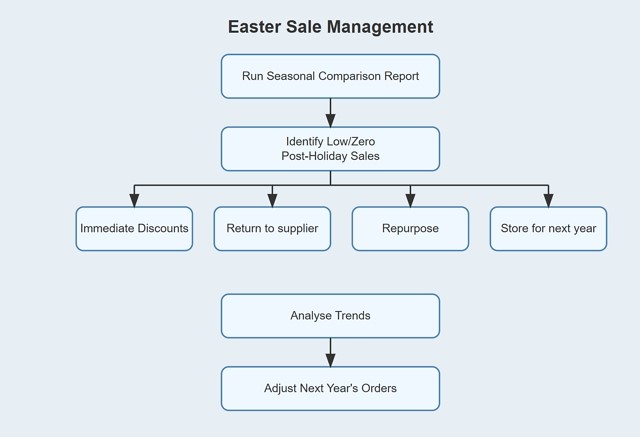
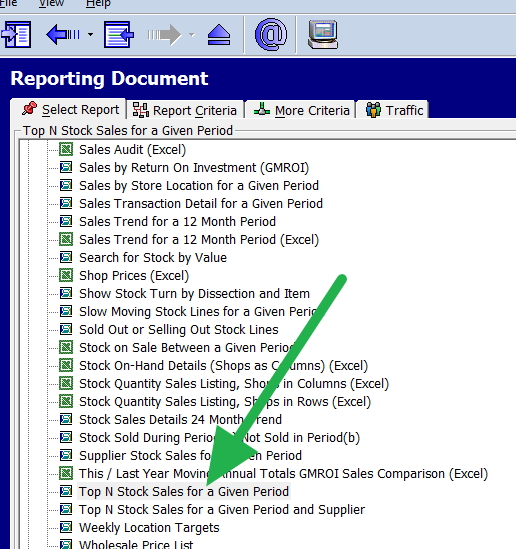
Test 1: Long Trend Stock Report Analysis

The first test was designed to evaluate how the AI would perform if it were given a vast amount of data that retailers are receiving. If the AI cannot handle the data, it's of minor use to retailers. Retailers have lots of data today.

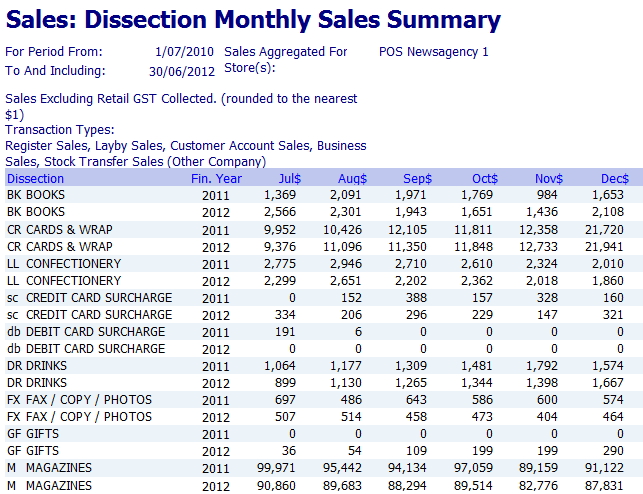
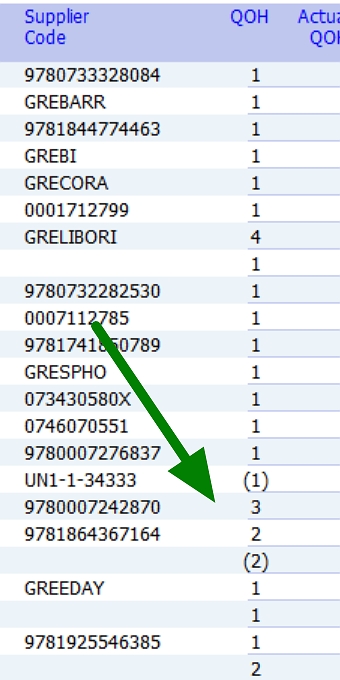
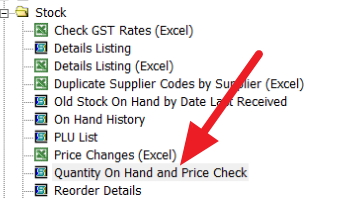
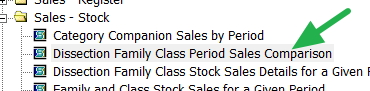
Now, understanding inventory performance is critical for any retailer. Seasonal trends, slow-moving items, and bestsellers all impact their bottom line, so we ran a comprehensive stock trend report spanning hundreds of pages. It's the kind of data most retailers can obtain but rarely find the time to analyse correctly. Our test data spanned 12 months and exceeded 300 pages in length.

Tool Performance

ChatGPT

Failed almost immediately, as it ran out of credits, rendering it essentially useless for comprehensive stock evaluation. Even before hitting its limits, it failed to provide actionable insights that would aid practical retail decisions. The reality is that a retailer, after running this report, would almost certainly want to rerun it to see whether anything different changes the outcome. I might have tested this year and last year, but here I get nothing. As such, we immediately dropped ChatGPT.

Claude

Initially performed better. It identified some fundamental product trends on the first run. Then it ran into credit limits. However, it did identify some fundamental product trends, but its inability to handle follow-up questions made it impractical for the iterative nature of retailers' needs. As such, we dropped it immediately.

DeepSeek

Attempted a different approach to the credit limit problem. It took only a tiny section (6%) of the information. While this allowed it to complete the task without running out of resources, it did not give much.

Google AI

The first problem was that Google required CSV files, while all the others accepted Excel format, which we preferred. However, it did identify fundamental product trends; however, we all felt it lacked the depth needed for effective inventory management. Its surface-level insights wouldn't provide much of a competitive advantage for retailers looking to optimise stock levels.

Grok 3

Boy, were we impressed with this AI. It took the entire report without issues. It then provided a detailed trend analysis that would help retailers make smarter decisions. For example, it identified some products specifically for BBQs and reported that they sold well during the summer. It also spotted anomalies that would be easy to miss in manual review, such as products that underperform only during specific weather conditions.

Qwen

It performed admirably by identifying anomalies and supplier diversity trends, though it didn't match Grok 3's depth. It correctly helped identify problematic stock items. Unfortunately, it offers fewer actionable recommendations for improvement than Grok 3.

ChatGPT failed

AI Model Ave Score
Grok 3 9/10
Qwen 8/10
Google AI 7/10
Claude 7/10 Limited
DeepSeek 7/10

Test 2: Trial Balance Analysis

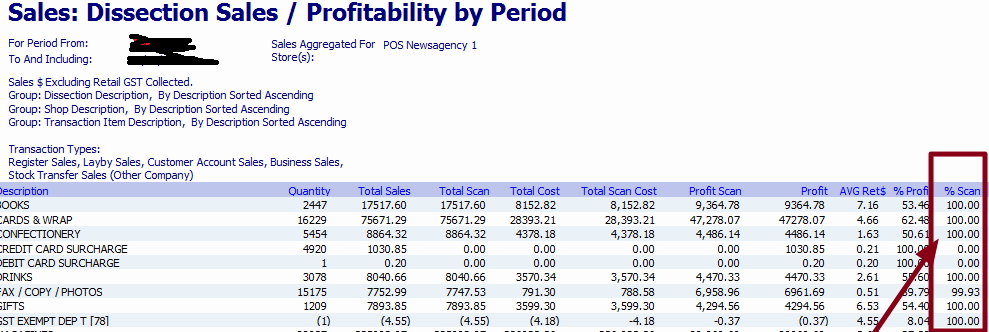
Accurate financial reporting is the backbone of retail success. The second test focused on a small compact trial balance dataset. What we wanted was an analysis that didn't require an accountant to understand.

Tool Performance

DeepSeek

It produced precise observations but struggled with depth when analysing discrepancies. Its summarised approach meant that nuanced financial issues, which could significantly impact a retail business, were overlooked.

Google AI

Here, we got straightforward summaries that aligned with our general ledger data but it lacked depth in identifying anomalies. We felt that although it was helpful for essential reconciliation, it wouldn't alert a retailer to subtle patterns.

Grok 3

Wow, it delivered a detailed financial summary with cross-referenced data for accuracy. It flagged discrepancies that required further investigation, allowing us to explore these issues. This capability could be invaluable for retailers without accounting expertise in maintaining the financial health of their business.

Qwen

It did a good job of highlighting significant balances and unexpected changes effectively. Again, it did not match Grok 3's level, but it did come up with much good stuff.

AI Model Ave Score
Grok 3 9/10
Qwen 8/10
Google AI 7/10
DeepSeek 6/10
Claude N/A

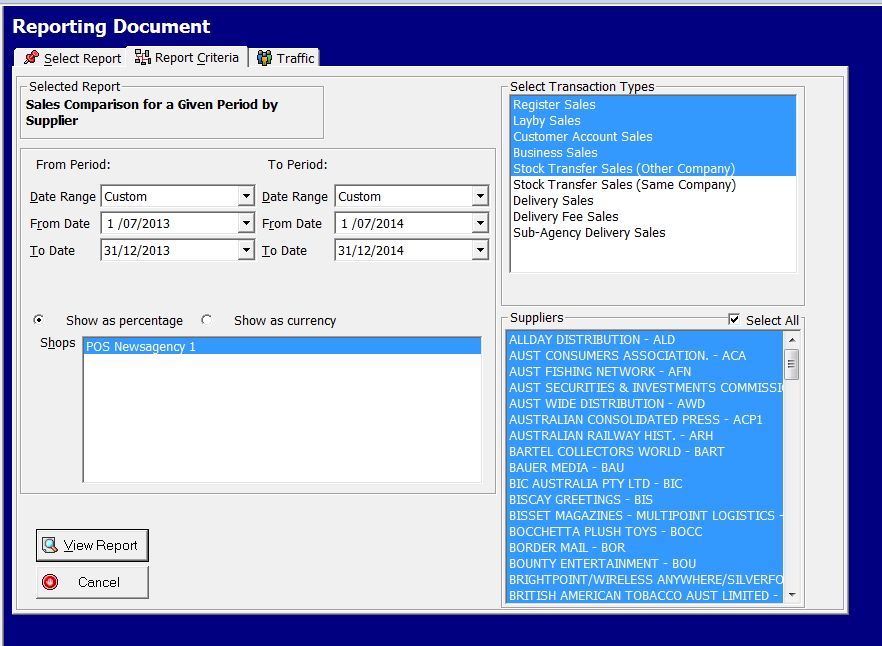
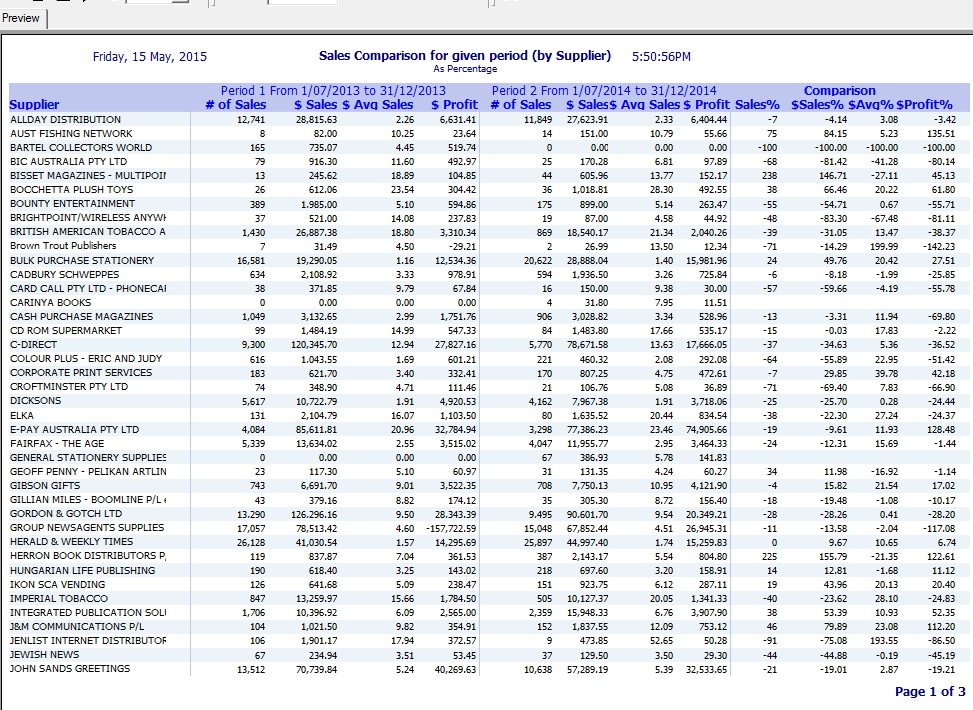
Test 3: Supplier Purchases Report

Managing supplier relationships is critical for maintaining healthy margins and consistent product availability. The third test examined a supplier purchases report to evaluate performance, track expenditures, and identify inefficiencies.

Tool Performance

DeepSeek

It did produce some quick overviews. It struggled with detailed metrics, such as cost per transaction or order accuracy. Its summarised approach meant it missed some critical inefficiencies; we did not think it was trivial, as these sorts of things directly impact margins.

Google AI

It did provide a structured summary but lacked in-depth spending analysis by category or supplier benchmarking. While helpful for basic understanding, we did not see key KPIs, such as identifying problematic vendors.

Grok 3

It did offer comprehensive supplier evaluations with detailed metrics. It identified inefficiencies. We thought it was suitable for managing dozens of suppliers. It was good, with its actionable tips.

Qwen

It did highlight anomalies as well as Grok 3 in the supplier but lacked actionable details.

AI Model Ave Score
Grok 3 9/10
Qwen 8/10
Google AI 7/10
DeepSeek 6/10
Claude N/A

Summary Performance 

When evaluating these tools specifically for retail applications, clear patterns emerged across all three test scenarios:

Tool Stock Analysis Financial Analysis Supplier Analysis POS Integration Overall Rating
ChatGPT We do not think its free version is suitable for retailers. Failed
Claude Limited Accurate but limited Decent but restricted Good 6/10
DeepSeek Partial (missed trends) Clear but shallow Quick but surface-level Good 6/10
Google AI Consistent but basic Straightforward Structured but limited Limited 7/10
Grok 3 Comprehensive Detailed Comprehensive Good 9/10
Qwen Good anomaly detection Highlighted changes Good diversity insights Good 8/10

Practical Implementation for Your Retail Business

Understanding how these tools perform in controlled tests is helpful, but implementing them in your daily operations is where real value emerges. Here's a practical approach to leveraging AI for business improvement.

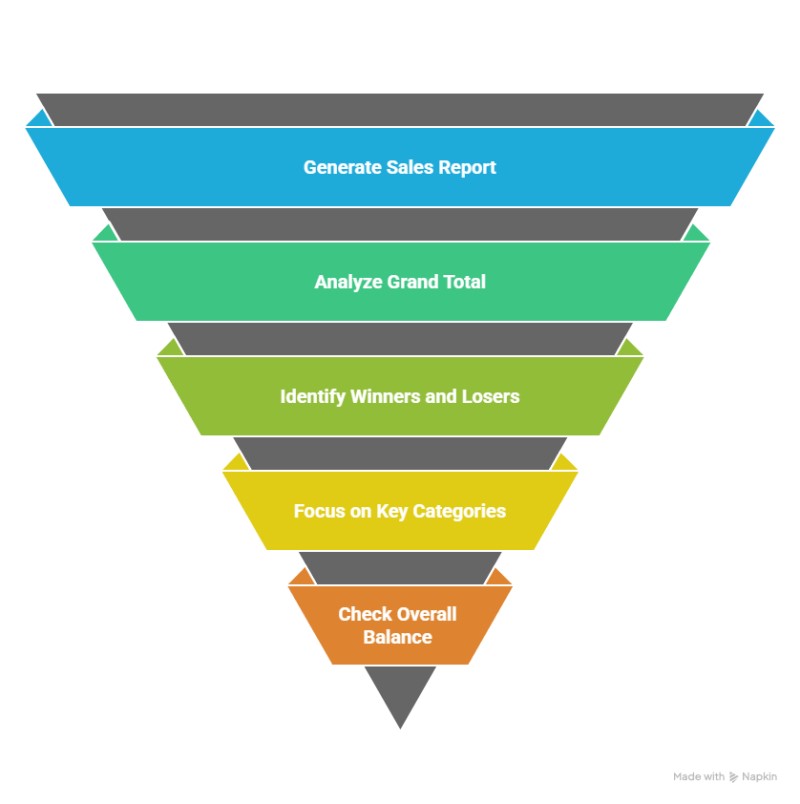
Start Small and Focused

Begin with a specific business challenge rather than trying to analyse everything at once. Consider identifying your slowest-moving stock items for clearance, evaluating which suppliers offer the best value for similar products, or analysing sales patterns to optimise staffing during peak hours. Starting with a focused approach allows you to see tangible benefits quickly while building your comfort with the technology.
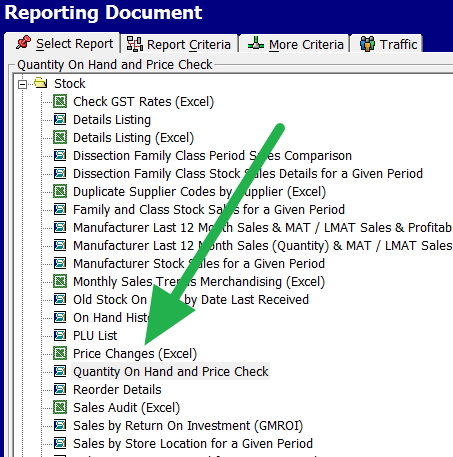
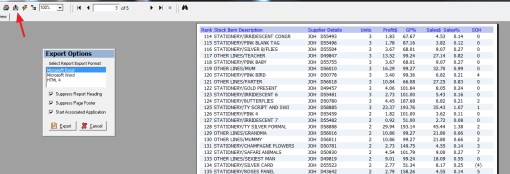
Prepare Your Data

Export relevant reports from your POS system in a format your AI tool can process. Depending on what tool you use, you need CSV or Excel. I prefer Excel but its your call. Check first that your data is clean and good. If you feed the AI rubbish, you will get rubbish back.

Ask Specific Questions

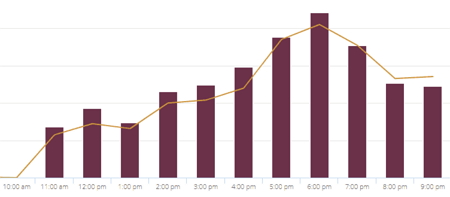
Frame your queries in specific, actionable terms rather than general requests. Instead of asking the AI to "Analyse my stock," try something more targeted, such as "Which product categories show seasonal patterns, and when should I increase inventory for winter?" Similarly, rather than requesting the AI to "Check my finances," ask, "Are there any unusual expense patterns compared to last year, and which categories show the largest percentage increases?" Specific questions yield specific, actionable answers.

We found that general queries often provided incorrect answers, requiring multiple attempts to obtain a satisfactory response.

Implement Findings Systematically

Test your questions systematically and record the question that yields the answers you want. This systematic approach ensures that AI becomes a valuable part of your business improvement cycle rather than just an interesting experiment.

Focus on applying insights

The best analysis is useless if it is not applied. Each of your analysis sessions should end with clear action items to be implemented and tracked.

Recommendations for Australian Retailers

Based on comprehensive testing and practical retail experience, here are my specific recommendations for retailers looking to leverage free AI tools:

Use Grok 3 as your primary analysis tool. I am told it will soon be charged, but now it appears to be the best in the free AI market. We were impressed with its ability to handle complex questions and our interactive questions, which is excellent if, like me, you like following your natural curiosity.

"A good question in business does not lead to an end; a good question opens doors you never knew existed."

Consider using Qwen; it's excellent. We found it helpful as it gave a good second opinion. It can be especially valuable when making significant business decisions.

If you're currently using ChatGPT or Claude, be aware of their significant limitations for business analysis. Their credit restrictions make them impractical for the iterative analysis that delivers real value. You may find yourself frustrated when analysis suddenly stops.

Conclusion: The Future of Retail Intelligence

Retailers, rather than using intuition alone, can use the Free AI tools now available to gain insights.

Written by:

Bernard Zimmermann


Bernard Zimmermann is the founding director at POS Solutions, a leading point-of-sale system company with 45 years of industry experience. He consults to various organisations, from small businesses to large retailers and government institutions. Bernard is passionate about helping companies optimise their operations through innovative POS technology and enabling seamless customer experiences through effective software solutions.


Add new comment

Restricted HTML

  • Allowed HTML tags: <a href hreflang> <em> <strong> <cite> <blockquote cite> <code> <ul type> <ol start type> <li> <dl> <dt> <dd> <h2 id> <h3 id> <h4 id> <h5 id> <h6 id>
  • Lines and paragraphs break automatically.
  • Web page addresses and email addresses turn into links automatically.
CAPTCHA This question is for testing whether or not you are a human visitor and to prevent automated spam submissions. Image CAPTCHA
Enter the characters shown in the image.

How to cull the number of products

POS SOFTWARE

How to cull the number of products

To effectively cull products, you must analyze sales data to identify underperforming items, conduct market research to grasp customer preferences, and account for factors such as shelf space, product lifecycle, and profitability. Make informed decisions based on these crucial insights. Others and I have seen how reports boost shop profits. Today, we'll explore how our modern point-of-sale (POS) software can do that.

The Power of POS Software

POS software can give you a competitive edge by allowing you to make informed decisions about your POS system.

The 80/20 Rule: A Cornerstone of Retail Strategy

Consider the 80/20 rule, the Pareto Principle, as a cornerstone of retail strategy. It asserts that approximately 80% of revenue is generated by just 20% of your product range. Understanding this principle is crucial for optimising your inventory and concentrating on high-performing products.


Here is a graph of sales in a lottery shop. Take a look at it please.

This fascinating example illustrates the Pareto Principle, I confess I was struck by how closely it followed. I used one year of a lottery shop's sales data, which reveals. I'm sharing below how to make a graph for your shop. The essential point here is that:

- 20% of product lines generated 80% of sales
- Remarkably, just 9% of items accounted for 60% of sales (see red arrow).

This distribution closely reflects the Pareto Principle and has key implications for retailers. While this example supports the principle, remember that exact percentages may vary. The principle is a guideline rather than a fixed law. This lottery shop data shows the 80/20 rule's relevance in retail, especially for our customer base.

Simplifying Product Management

Most majors, such as supermarkets, simplify their operations by reducing the number of items in each category.

Why Fewer Products Can Mean More Profit

Space Optimisation

Eliminating low-performing products has many advantages, eg freeing up valuable shelf space for stuff that does sell.

Reduced Inventory Costs

Fewer products mean less capital in stock.

Simplified Operations

With fewer items to manage, your staff can focus on providing better customer service.

Clearer Customer Choice

Too many options overwhelm customers.

Leveraging POS Software for Smart Analytics

Our POS software offers a range of features that can help retailers interested in culling their stock in real-time and user-friendly:

Go to the Register reports.

Now pick "Top N Stock Sales for a Given Period."


Now, in the form, put in the last four weeks. Pick a category. Run, and this will result in a report with your champs on top.

Putting Analytics into Action

Here's a practical example of how to use these analytics to optimise your inventory:

Run Regular Reports

Use your POS software to generate "Top N Stock Sales" reports for the past four weeks.

Analyse by Category

It is easier to work by category or department, so try looking at the performance within each product group.

Identify Winners and Losers

Your top performers will be seen on the top, while the washouts will be on the bottom.

For top performers,

Please make sure you're always well-stocked on these items.

For poor performers

Could you consider clearing out of these items to remove them from your inventory?

Other considerations

While sales volume is crucial, don't forget about other important metrics:

Profit Margins

Sometimes, lower-volume products have higher profit margins.

These items are challenging as many products might perform poorly overall but have strong seasonal sales.

Customer Loyalty

Certain products might not be top sellers but could be crucial for retaining loyal customers.

Key Benefits of POS Analytics

Implementing POS analytics can provide significant advantages to retailers:

Improved Decision-Making

Instant real-time data enables retailers to make better decisions.

Enhanced Customer Experience

Understanding customer behavior allows retailers to personalise interactions.

Optimised Inventory Management

POS analytics helps retailers minimise stockouts and overstock. It reduces costs and so increases profitability.

Increased Sales and Revenue

POS analytics drives sales growth by identifying cross-selling opportunities.

Competitive Advantage

Data insights help retailers spot trends and adapt strategies.

Conclusion

Effective inventory management is essential, and your POS software can help.

Your profits will benefit!


Written by:

Bernard Zimmermann


Bernard Zimmermann is the founding director at POS Solutions, a leading point-of-sale system company with 45 years of industry experience. He consults to various organisations, from small businesses to large retailers and government institutions. Bernard is passionate about helping companies optimise their operations through innovative POS technology and enabling seamless customer experiences through effective software solutions.


Add new comment

Restricted HTML

  • Allowed HTML tags: <a href hreflang> <em> <strong> <cite> <blockquote cite> <code> <ul type> <ol start type> <li> <dl> <dt> <dd> <h2 id> <h3 id> <h4 id> <h5 id> <h6 id>
  • Lines and paragraphs break automatically.
  • Web page addresses and email addresses turn into links automatically.
CAPTCHA This question is for testing whether or not you are a human visitor and to prevent automated spam submissions. Image CAPTCHA
Enter the characters shown in the image.

Find the details of your many shop's peak hours.

POS SOFTWARE

Sales by hour report


Identifying peak sales hours is crucial for proper staff scheduling. Yet, typical point-of-sale reports often miss important details. By doing this, it can significantly impact your retail operation and profitability.

Here we will discuss 

- Retail staff scheduling best practices

- Data-driven employee scheduling

- Sales forecasting for retail scheduling

- Optimising retail schedules with POS data

- Hourly sales analysis for staffing

The 50/20 Rule

When you measure shop sales by hours, which we have done, you may like us be surprised how closely most of our customers' shops followed the 50/20 rule. If you examine your shop, you will find that approximately 50% of its total and traffic sales occur during the 20 busiest hours in a week. This seems true of all shops, no matter what they do or how big or small. What we did find was that different shops recorded different peak segments. Adequately staffing these peak 20 hours is considered the most effective way to drive sales, and knowing your peak hours informs critical business decisions about staffing, inventory, and marketing.

This is why knowing them is so important. If you have not identified them, you can click here.

Our research demonstrates that our clients who increased their staffing coverage during peak hours experienced an improvement in sales. What this means for your business is compelling: without increasing your overall labor budget, you can potentially boost sales simply by addressing your peak hour coverage.

Some forward-thinking retailers leverage this data strategically by running targeted promotions during traditionally quieter periods. If you are doing loyalty marketing, it's great.

The Complexity of Retail Staffing

Retail operations encounter complex staffing challenges as each department sees distinct customer traffic patterns. Your stationery department may thrive on weekends, while the book section experiences its peak during weekday evenings. Additionally, these patterns change with the seasons—holiday shopping generates significantly different demands compared to back-to-school periods.

You need department-specific sales data broken down by hour to optimise staffing across your entire operation. The good news? Your POS system already captures this valuable information, and accessing it is simpler than you think.

Harnessing the Power of Your POS Data

Here's how to unlock this game-changing information in just 10 seconds:

  1. Navigate to your POS reporting dashboard
  2. Select "Cash Register Reports" from the main menu
  3. Click on "Sales - Register" in the dropdown menu
  4. Choose "Dissection Sales by Hour" from the available report options
  5. Set your date parameters to match the equivalent period from last year (e.g., if planning for March 2026, analyse March 2025)
  6. Generate the report to view department-specific hourly sales data

This report is your secret weapon for data-driven scheduling. It provides a detailed breakdown of sales by department and hour, allowing you to identify peak times for each section of your shop.

Transforming Data into Action

With this powerful report in hand, you're now equipped to:

  • Identify which departments need additional staffing during specific hours
  • Schedule your top performers during department-specific peak periods
  • Adjust staffing levels seasonally based on historical patterns
  • Reduce labour costs during consistently slow periods across departments

One of our customers told me, "The most successful retailers today are those who analyse their sales data at the department level. This scheduling report ensures you have the right people in the right place at the right time". It directly improves customer satisfaction.

The Impact on Your Bottom Line

The benefits of implementing department-specific scheduling based on hourly sales data are substantial. Retailers who adopt this strategy typically see a reduction in labour costs while maintaining or improving sales performance.

One study here found that staff schedules using POS data like here by implementing more stable scheduling practices increased sales by up to 7%. It also ensures adequate coverage during department-specific peak hours.

Putting It All Together

Would you be ready to change your scheduling approach? Here's your action plan:

  1. Generate your first department-specific hourly sales report today
  2. Identify at least three opportunities to optimise your staffing
  3. Schedule a 15-minute team meeting to implement these insights for next week's roster
  4. Monitor the impact on sales and customer satisfaction over the next month
  5. Refine your approach based on the results

We want the right staff in the right place at the right time.

The Payoff

Don't let valuable insights from your POS system go to waste. You can start leveraging your sales-by-hour data today and watch as your shop turns into a model of retail efficiency. Your staff will appreciate the well-thought-out schedules, your customers will enjoy better service, and your bottom line will thank you.


Written by:

Bernard Zimmermann


Bernard Zimmermann is the founding director at POS Solutions, a leading point-of-sale system company with 45 years of industry experience. He consults to various organisations, from small businesses to large retailers and government institutions. Bernard is passionate about helping companies optimise their operations through innovative POS technology and enabling seamless customer experiences through effective software solutions.


Add new comment

Restricted HTML

  • Allowed HTML tags: <a href hreflang> <em> <strong> <cite> <blockquote cite> <code> <ul type> <ol start type> <li> <dl> <dt> <dd> <h2 id> <h3 id> <h4 id> <h5 id> <h6 id>
  • Lines and paragraphs break automatically.
  • Web page addresses and email addresses turn into links automatically.
CAPTCHA This question is for testing whether or not you are a human visitor and to prevent automated spam submissions. Image CAPTCHA
Enter the characters shown in the image.

Boost Your Shop’s Performance with Supplier analysis

POS SOFTWARE

Suppliers tend to prioritise larger retailers because of their product stupidity (If a large retailer is not monitored, they often do stupid things), higher spending power and perceived reliability. SMB retailers face problems securing favourable terms, yet SMBs need to establish supplier relationship management despite these obstacles.

Ask your suppliers where your business fits in their priorities. Understanding your position can help you tailor your approach, such as negotiating better terms or diversifying your supplier base.

Diversify Your Supplier Base

Relying on a single supplier puts your business at considerable risk, including stock shortages or price hikes. What you should consider is diversifying your supplier base:

  • You reduce dependency risks.
  • You gain leverage in negotiations by having alternative options.
  • You ensure consistent product availability.
  • Have a better pool of products to select from.
  • You're not left stranded if one supplier faces disruptions.

Actionable Step: Use your POS system to track supplier sales performance. Could you identify which suppliers are underperforming and explore alternatives to fill gaps?

Negotiate Beyond Price

Negotiation isn't just about securing the lowest price; it is about more. Often, the seller has more flexibility than initially disclosed, but you must be willing to ask first.

What to Negotiate:

  • Extended payment terms (e.g., 30-day credit).
  • Bulk discounts or promotional pricing.
  • Marketing support
  • Shipping Terms

For example, I received a huge order and told our supplier I needed a better trading term to help me get the order and fast delivery. I got both. Remember, you can negotiate improved trading terms and expedited delivery by highlighting the mutual benefits for both parties.

Pro Tip: Once you've diversified your supplier base, use their competition as leverage during negotiations.

Conduct Independent Research

Suppliers may present information that benefits their agenda but verify everything independently. Ask your customers, visit similar shops, examine the advertising, use your POS reports, and do Google searches. I find that Amazon's top-selling lists in Australia are beneficial resources. Check here.


These are some items to check:

  • Compare sales data between Supplier A and Supplier B for similar products.
  • Assess whether each supplier's margins meet your financial targets. Some suppliers hide their margins, which can be a problem. A typical problem is that some quote markup and some margins. Always work in margins.
  • Investigate alternative suppliers offering better terms or unique products.

Offer Products at Multiple Price Points

Stocking products at different price levels allows you to cater to diverse customer segments while also strengthening supplier relationships:

  • Budget-friendly options attract cost-conscious shoppers.
  • Mid-range products appeal to the average buyer.
  • Premium items target customers seeking quality or exclusivity.

This strategy not only broadens your market reach but also creates upselling opportunities.

Leverage Technology for Efficiency

Your POS system has an invaluable tool for managing supplier relationships and improving operational efficiency:

  • Use the report "Sales Comparison by Supplier" to rate your suppliers.
  • Automate reordering processes based on sales trends.
  • Monitor margin creep (declining profit margins) and address it with suppliers promptly.

Use Sales Comparison by Supplier

Use the "Sales Comparison by Supplier" report in your POS System. This report will show you͏ the actual figures, and the͏ changes over time for each supplier. By ͏analysing your suppliers, you can gain valuable insights about your shop based ͏on various criteria such as the number of sales, total value of sales, average sale amounts and ͏profit. For example, it is important to determine which suppliers are unde͏rperforming or overper͏forming. Check if they are giving you enough margins to meet your needs.͏

How to Access the "Sales Comparison by Supplier" Report

To access the "Sales Comparison by Supplier" report, follow these steps:

It is in the register sales reports; find the report "Sales Comparison by Supplier."

Click on it, and you will get this screen.

How to Interpret the "Sales Comparison by Supplier" Report

You have a report of your suppliers that shows you the summary statistics for each supplier. They are based on each criterion you selected and a comparison of how you have been travelling with them. The big ones and those with significant movements in the comparison percentages are fascinating.

Look at the profit figure. Today, we are seeing significant downward margin creep. This is an excellent place to see it. There appear to be many reasons for this downward margin, and it seems to be both due to changes in customers and suppliers. I will discuss this in another article.

Now, rerun this report and compare suppliers based on those that handle similar products. Now, compare and contrast these different suppliers based on their performance over time, noting the number of sales and profit.

Build Strong Relationships

Suppliers are more inclined to give more to retailers they see as partners instead of merely vendors.

How to these relationships:

  • Please make sure to let them know about your needs and concerns often.
  • Pay invoices on time to build trust.
  • Show loyalty by prioritising their products when possible.

  • Tell them information that they may find helpful.

For example, if a supplier launches a new product line, consider promoting it immediately. This shows commitment and builds goodwill.

Take action Based on Data Insights.


Supplier options


How to Customise the "Sales Comparison by Supplier" Report

To customise the "Sales Comparison by Supplier" report, follow these steps:

Select a period for the report, let us keep it simple so start with the past 12 months and compare it with the previous 12 months. So leave it AS IS and run the report. Afterwards, feel free to explore more options as desired.

Screenshot of Customised Sales Comparison by Supplier Report

Supplier report


Using data-driven insights from tools like the "Sales Comparison by Supplier" report allows you to make informed decisions:

  1. Identify underperforming suppliers. Then, address any concerns with them directly.

  2. Strengthen relationships with high-performing suppliers.

  3. Monitor trends such as declining margins and/or dips in sales.

Example: If Supplier A's products exhibit decreasing margins over time due to increasing costs, renegotiate the terms or consider switching to Supplier B, which has superior profitability metrics.

Challenges and Opportunities

I encourage you to contact underperforming suppliers and express your concerns. Please also inquire about how you can collaborate more effectively with well-performing suppliers and how to do more with them.

Please give it a go and see how it goes.


Add new comment

Restricted HTML

  • Allowed HTML tags: <a href hreflang> <em> <strong> <cite> <blockquote cite> <code> <ul type> <ol start type> <li> <dl> <dt> <dd> <h2 id> <h3 id> <h4 id> <h5 id> <h6 id>
  • Lines and paragraphs break automatically.
  • Web page addresses and email addresses turn into links automatically.
CAPTCHA This question is for testing whether or not you are a human visitor and to prevent automated spam submissions. Image CAPTCHA
Enter the characters shown in the image.

Measure Your Shop's Valentine's Day Sale

POS SOFTWARE

young man and woman shopping Valentines Day

Valentine's Day offers retailers a chance to increase sales, but achieving understanding involves more than just figures.

It's crucial to analyse your store's performance to determine what worked well and what did not and to improve. Here’s a guide to assist you in evaluating your Valentine’s Day sales.

Last-Minute Shoppers

Many Valentine's Day purchases are impulsive, so people buy even after the holiday. Please keep displaying your themed products for a little. Also, remember that some bargain hunters are now looking.

The Importance of Measuring Sales for Businesses


To measure is to know

Businesses need to measure during busy seasons such as Valentine's Day. These days are unusual, and what you find on them can work against you because they are uncommon. This makes it harder to make decisions. Luckily, tracking sales has become more straightforward and practical with a modern POS system.

Sales Reports

Sales reports are crucial tools for monitoring sales performance. They show your profit, bestselling products, and employee performance. Using these reports, you can identify trends and make data-driven decisions.

How to Track Sales Performance

Go to reports and click on sales.

Point of sale menu selection for compare


This report will allow you to check how each department in your shop is doing compared to previous periods.

Now select the dates you are interested in, 14 February 2025 and 14 February 2024

I am ignoring all the extra options for this example. Please feel free to review this later after you work through this example.

When reviewing reports, navigate the left-hand menu to focus on the most relevant departments. It will help you pinpoint areas of success and those needing improvement.

The advantages of utilising sales reports: By analysing sales data, you can determine, in particular, the bestselling products and employee performance. Your business strategy must be to gain insights to maximise profits. If you follow what happened on those days, you can identify trends that you need to make informed decisions. It will help your businesses make data-driven decisions.

Another good way to measure sales on Valentine's Day is through employee sales analysis. It is interesting because, by analysing sales data, you can identify employees who perform well.

Top-Selling Products

Create a list of your best-selling items! Did red roses or heart-shaped chocolates fly off the shelves? Also, please remember items that didn't sell well; each has a story for me. In my experience, it's best not to fight the market if the public wants these heart-shaped chocolates from you; give them to them and do not try to do better.  

Leftover Stock

Everyone hates these items if they cannot be sold after Valentine's Day. These items highlight what did not resonate with customers, so if you're left with too many red candles or gift baskets, make a note for next year.

Sold-Out Items

Which products sold out too quickly is more important? These cost you money. For instance, if heart-shaped chocolates sold out too quickly this year, plan to increase inventory next year.

Summary

> Valentine's Day is an excellent time for businesses to boost sales, but it requires strategic planning and measuring sales.

> Measuring sales during busy seasons such as Valentine's Day is essential.

> Sales reports are great for monitoring sales performance.

> Employee sales analysis is another way to measure Valentine's Day sales. It can identify high-performing employees and those who need more training. Using this information, you can boost sales.


Businesses can use this information to boost sales and customer satisfaction.

Add new comment

Restricted HTML

  • Allowed HTML tags: <a href hreflang> <em> <strong> <cite> <blockquote cite> <code> <ul type> <ol start type> <li> <dl> <dt> <dd> <h2 id> <h3 id> <h4 id> <h5 id> <h6 id>
  • Lines and paragraphs break automatically.
  • Web page addresses and email addresses turn into links automatically.
CAPTCHA This question is for testing whether or not you are a human visitor and to prevent automated spam submissions. Image CAPTCHA
Enter the characters shown in the image.

Maximising Profits in Your Shop with Gifts

POS SOFTWARE

Maximising Profits in Your Shop with Gifts
Running a gift in your shop can be rewarding, but success hinges on understanding the financials and implementing effective strategies. Let's explore how you can boost your shop's profitability.

Location: The Foundation of Your Success

Before diving into operational strategies, it's crucial to recognise the impact of location on gifts. Gift shops in high-tourism areas often perform better due to increased foot traffic and demand for souvenirs. When looking at your location, consider:

  • Proximity to tourist attractions
  • Local demographic trends
  • Competition in the area
  • Potential foot traffic

Of course, a prime location will significantly boost your sales potential and create higher profits.

Expanding Your Gift Shop with cloths

Although not gifts, adding clothing can significantly boost your profits and attract a broader customer base. The average Australian spends about $200 a month on clothin. We are some of the top spenders on clothes in the world.

When selecting clothes for your shop, consider whether your items appeal to tourists. T-shirts with local designs or slogans work. If you are in a coastal area, look at beach cover-ups.

Jackets, hats, etc are good as you do not need a changing room.

You'll want to stock a variety of sizes to cater to different body types, so remember to adjust your inventory based on the time of year and local climate.

Consider related items, such as hats, beanies, etc.

When pricing your clothing items, aim for a markup between 2.2 and 2.5 times the cost price. It will give you a decent profit margin while being competitive. Consider offering bundle deals to encourage multiple purchases, which can increase your average transaction value.

Effective display and merchandising can significantly impact your clothing sales by creating visual interest in your shop. Grouping complementary items can encourage add-on purchases, boosting your overall sales. It's important to rotate your displays regularly to keep the shop looking fresh and exciting, enticing repeat customers to see what's new.

Phone cases

Phone Cases

Australians buy a phone on average once every four years, which is about 9 million a year. Since new phones are different sizes, almost everyone buying one needs a new case. Since cases are replaced more frequently than phones, it is reasonable to estimate that tens of millions of phone cases are sold annually in Australia.

They do not take up much room, but they do need a stand, which must be organised by type, e.g., iPhone, Samsung, and other brands.

Then, you need to sort them by model; ensure you have the latest with a range of rugged, slim, leather, or eco-friendly cases.

Look at your price points. You need to offer budget-friendly and premium options to accommodate different customer preferences.

To sell them, though, you need some product knowledge.

Understanding Gift Profit Margins

One point that I have noticed is that those who do well in gifts are people who grasp the key financial metrics and know and monitor your numbers:

Gross Profit Margin

Gifts typically achieve a gross profit margin of 40% to 51% in a successful shop.

Net Profit Margin

You need to check your expenses, as the net margin is 12% to 22% for those shops that sell gifts; the additional costs are more than the cost of the goods.

Essential Financial Metrics for Gift Success

Understanding your financials is crucial, so studying your profit and loss (P&L) statement is worth studying. Consider it your business compass as it shows the critical metrics about your expenses. Pay close attention to these key percentages:

  • Cost of goods sold (COGS): Typically 48% to 56% of revenue for gift shops
  • Rent: Can range from 6% to 20% of turnover
  • Wages: A significant expense that needs careful management. To sell gifts, you often need staff who know the product.

Keys to Success in the Gift Shop Business

Now that we understand the profit potential let's explore the key strategies that will help you achieve and exceed these industry benchmarks.

1. Grow Your Sales

While cost-cutting can improve margins, in my experience, it's not a path to success; sustainable success comes from growing sales. Consider these strategies:

  • Create a unique product stand with relevant gifts together.
  • Make the stand inviting.
  • It needs to be somewhere your customers can see it
  • Plan your inventory around peak holiday seasons to maximise sales

2. Price Strategically

Retail pricing is often recommended with a markup strategy of 2.5 times the cost price. This allows for a healthy gross margin while remaining competitive. However, I suggest walking into a few competitors nearby and getting a feel for their price points. See what they are getting. It will tell you what people in your area will pay.

3. Improve Efficiency

Enhance your shop's efficiency to control costs and improve customer experience:

  • Streamline inventory management
  • Optimise shop layout for easy restocking and customer flow
  • Invest in a reliable point-of-sale (POS) system for faster transactions and better inventory tracking

4. Analyse Your Product Mix

Regularly review your product performance:

  • Identify high-margin items driving profitability
  • Recognise popular products that attract customers
  • Discontinue or discount underperforming items.
  • As a rule, you need about 10 new products constantly.

Advanced Strategies for Revenue Growth

To take your gift shop to the next level, consider these advanced tactics:

  1. Develop an e-commerce presence to reach customers beyond your local area. Pair your online store with a reliable ecommerce fulfillment system to ensure timely delivery, accurate order processing, and customer satisfaction.
  2. Implement a customer loyalty program to encourage repeat business
  3. If relevant, look at unique, locally-made products

Success lies in working smarter and making informed decisions based on your business data and market trends.

Add new comment

Restricted HTML

  • Allowed HTML tags: <a href hreflang> <em> <strong> <cite> <blockquote cite> <code> <ul type> <ol start type> <li> <dl> <dt> <dd> <h2 id> <h3 id> <h4 id> <h5 id> <h6 id>
  • Lines and paragraphs break automatically.
  • Web page addresses and email addresses turn into links automatically.
CAPTCHA This question is for testing whether or not you are a human visitor and to prevent automated spam submissions. Image CAPTCHA
Enter the characters shown in the image.

Find your actual margins

POS SOFTWARE

Supplier quoted vs actual margins
Understanding your actual profit margins is crucial for retail success. While supplier-provided figures offer a starting point, after years of experience, I can assure you that their figures are often wrong. I do not trust them, and neither should you. What you need to do is verify your actual margins. In the real world, things can be different. Here is how to do it.

The Reality of Supplier-Provided Margins

Supplier-provided gross margins often paint an overly optimistic picture that may not align with your business situation. Many factors drive margins. Salespeople are rarely the sort of people who can calculate the details. They take the figures they are given and quote them to you.

Verifying Your Actual Margins

Go to the menu

Discount retail report selection


Now in sales, select  the "Discounted Item Sales Summary."

Discount retail report

Pick a period. I suggest the last 12 months and now check; I would recommend it as a first attempt by the department.

Now you will get a detailed report of where you are discounting by quantity and price.

Actionable Insights from Margin Analysis

Understanding your actual margins can lead to valuable business decisions:

Pricing Strategy Refinement

Adjust prices on items with consistently lower margins.

Supplier Negotiations

Use actual margin data to negotiate better terms.

Inventory Management

Focus on stocking items with actual healthier margins.

Discount Strategy Review

Analyse the impact of discounts on overall profitability.

The Importance of Regular Margin Analysis

Making margin analysis a regular part of your business review process is beneficial. Who said today's price and margin are valid tomorrow? By consistently monitoring your actual margins, you can:

  1. Quickly identify trends or changes in profitability.
  2. Make data-driven decisions about product lines, pricing, and promotions.
  3. Maintain a clear understanding of your business's financial health.

Remember, average retail profit margins can vary significantly by department.

Conclusion

While supplier-provided margin information can be a helpful starting point, your sales data will always provide the most accurate and relevant insights for your business context. Regular analysis and adjustment based on this data will help you maintain healthy margins and drive your retail business towards greater profitability.

Ready to uncover your actual profit margins? Start by diving into your POS data today and discovering the real story behind your product profitability. Remember, knowledge is power in retail, and accurate margin analysis is the key to unlocking your store's full potential.

Add new comment

Restricted HTML

  • Allowed HTML tags: <a href hreflang> <em> <strong> <cite> <blockquote cite> <code> <ul type> <ol start type> <li> <dl> <dt> <dd> <h2 id> <h3 id> <h4 id> <h5 id> <h6 id>
  • Lines and paragraphs break automatically.
  • Web page addresses and email addresses turn into links automatically.
CAPTCHA This question is for testing whether or not you are a human visitor and to prevent automated spam submissions. Image CAPTCHA
Enter the characters shown in the image.

Transform Your Retail Success in 2025

POS SOFTWARE

Businessman looking at sales data

Data is the difference between thriving and getting by in today's retail. Retailers who understand their POS System are not guessing; they're making intelligent, informed decisions, which gives them a real edge. The key to your business's success lies in taking actions that drive actual results.


Retailers leveraging descriptive analytics, such as dashboards, have reported revenue increases of 4%–10%, particularly when these tools are actively used to guide decisions on customer relationship management (CRM), personalisation, and prospecting technologies.


Your POS system has the information to help you. It's there, waiting for you to dig in. Here is how to get some insights together to use them in 2025. Use these insights to transform your business performance and set the stage for a successful 2025.

Getting Started: Your First Data Deep Dive

Here's how you can tap into this resource to gain a clear picture of your performance:

Accessing Your Sales Comparison Report

I think knowing where your business is going is essential. 

Now is an appropriate time to take a quick look at how well you did in 2024, where you are now in retail strategy and compare your performance to previous years.

Go to register reports.

Menu selection for sales comparsion

Now select the item marked "Sales Comparison for a Given period".

Key Performance Metrics to Track

We'll first examine data from 2021 to 2024 to view your business movements. Here's how to do it:

Conducting a Four-Year Analysis

  1. First Comparison:

    • Input the date range: 01/01/2023 to 31/12/2023 AND 01/01/2024 to 31/12/2024.
    • Run the report and note key figures
  2. Second Comparison:

    • Return to the report and input: 01/01/2022 to 31/12/2022 AND 01/01/2024 to 31/12/2024.
    • Record key statistics

These data points give you a solid foundation for understanding your business's performance over the past two years.

Visualising

A simple graph of your annual turnover can provide a clear visual representation of your business's growth trajectory.

Go to the Cash register.

Then go to Sales - Register Select Dissection Monthly Sales Trend (Graph)

Now, I like to start with a long view first.

So you can choose 4 years to get a feel.

Please select the date range, in my case, 01/01/2021 to 31/12/2024

As you examine your four-year sales data, ask yourself:

  • Is there a consistent upward trend in turnover?
  • Are there any noticeable dips or spikes? What might have caused these?
  • How does your 2024 performance compare to previous years?
  • What factors might have influenced your sales performance over this period?

Now, go back and look at the past two years. Two years is good, as you can see from the seasonal variations, e.g., Easter before and the most recent.

Remember, this analysis isn't about numbers. It's about understanding the story. We are using these numbers to gain insights that will help us make a strategy for 2025 and beyond.

Leveraging Advanced POS Features

While this simple analysis provides valuable insights, your POS system offers even more advanced reporting capabilities. Use these features to uncover powerful insights that will drive your business decisions:

Looking Ahead: Your 2025 Strategy

Armed with these insights, you're well-positioned to craft a strategy for 2025. Consider:

  • Setting realistic growth targets based on your historical performance.
  • Identifying areas for potential expansion or improvement.
  • Planning inventory based on observed trends.
  • Develop marketing strategies that align with your sales patterns.
  • Staying updated on QR code usage trends can also help you integrate modern, contactless customer engagement tools into your 2025 strategy, such as QR codes for promotions, feedback collection, or loyalty programs.

For instance, if your data shows a 15% growth in clothing, consider expanding this category and highlighting it in your 2025 marketing plan.

Conclusion: The Power of Data-Driven Decision Making

I want you to know that understanding your business's performance is invaluable.

I can guarantee your competitors are using these insights to get ahead of you now. 

Add new comment

Restricted HTML

  • Allowed HTML tags: <a href hreflang> <em> <strong> <cite> <blockquote cite> <code> <ul type> <ol start type> <li> <dl> <dt> <dd> <h2 id> <h3 id> <h4 id> <h5 id> <h6 id>
  • Lines and paragraphs break automatically.
  • Web page addresses and email addresses turn into links automatically.
CAPTCHA This question is for testing whether or not you are a human visitor and to prevent automated spam submissions. Image CAPTCHA
Enter the characters shown in the image.

Creating a Dashboard with ChatGPT

POS SOFTWARE

ChatGPT


As a programmer specialising in retail and Point of Sale (POS) systems, I recently embarked on an intriguing experiment: using ChatGPT to create a dashboard without relying on my programming skills. Much discussion has been about ChatGPT enabling non-programmers to write code, with dashboards often highlighted as a key example. I decided to test this claim, and the findings were illuminating.

What's a Dashboard, Anyway?

A dashboard is a visual display that displays important information, commonly called Key Performance Indicators (KPIs). These provide a quick visual overview of the current situation, helping us make informed decisions without the need to sift through large amounts of raw data.

For retailers, dashboards transform massive sales data into actionable insights in seconds.

The Experiment: Following a Non-Programmer's Guide

To simulate the experience of a non-programmer, I followed a YouTube tutorial that promised to teach dashboard creation using ChatGPT.

So, I selected this YouTube here. Please feel free to consider this article as my response article to it.

So, I started with data from our POS software's Sales Report, which has comprehensive insights.

The ChatGPT Experience: Not Quite as Advertised

Data Wrangling Woes

My first hurdle was getting the data into the correct format. While our POS system can export to JSON, I followed the tutorial's suggestion. Later, I found that I had made the correct decision as I would dive into Excel many times to manipulate the data. It became a recurring theme throughout the process.

Contrary to the tutorial's claims, I quickly discovered that a free ChatGPT account wouldn't cut it. The credits ran out faster than a sausage sizzle on a Saturday morning. The experiment would have ended if I had not had access to a paid account. Let me know if anyone wants a paid account, and I offer reasonable offers. So, I switched to the paid account to continue this experiment.

Dashboard Dilemmas

After multiple attempts, I managed to create a basic dashboard. However, getting it to look presentable was another story entirely. As any retailer trying to spruce up their shop window knows, making things look good is most of the work.

Real-World Retail Challenges

Then, I ran into the problem of using real-world retail data in an experiment. In business, things are not cut and dry. I would encounter these problems here.

Consignment Stock

Items on consignment threw off profit calculations, as they had no listed cost.

Gift Cards

These presented a similar challenge to consignment stock.

Payouts

While these transactions affect sales numbers, they don't contribute to profit.

I only discovered these issues through this exercise, and it took time to learn these problems each time. The solution was to return to Excel, adjust the data, and recreate the JSON file. It was like constantly restocking shelves but with numbers instead of products and then recreating the dashboard.

The Programming Plot Twist

By now, I had spent many hours. So, when trying to calculate the total profit, I hit another wall. After many attempts, I had enough, so I resolved this by going outside the tutorial's framework. I had to break character and lean on my programming expertise. I delved into the HTML code generated by ChatGPT to understand what was happening behind the scenes. Only then did I finally wrangle the dashboard into something usable!

Now I had this, I could select a department, and it would give me these figures and charts.

Stock dashboard made with ChatGPT


Now I had something, but were the figures correct? After five hours of this exercise, I did not check, so it was unusable. In programming and business, it's rarely worth it for one-off jobs. You need stuff that, once done, repeats. Here, you must massage the data extensively before using it. The Bottom Line

It was presented as a quick and easy project for someone with moderate computer skills but turned into a time-consuming ordeal that required the following:

  • Over five (5) hours of work
  • Extensive Excel manipulation
  • The ability to read and understand HTML code
  • A paid ChatGPT account

Even after all that, I hadn't yet verified the accuracy of the figures—a crucial step that would likely take many hours more if they were wrong.

Lessons 

While quickly creating custom dashboards is appealing, the reality is not yet here.

Add new comment

Restricted HTML

  • Allowed HTML tags: <a href hreflang> <em> <strong> <cite> <blockquote cite> <code> <ul type> <ol start type> <li> <dl> <dt> <dd> <h2 id> <h3 id> <h4 id> <h5 id> <h6 id>
  • Lines and paragraphs break automatically.
  • Web page addresses and email addresses turn into links automatically.
CAPTCHA This question is for testing whether or not you are a human visitor and to prevent automated spam submissions. Image CAPTCHA
Enter the characters shown in the image.

Measure how your shop is doing?

POS SOFTWARE

Examining retail sales comparsions

Today, retail success depends on turning sales data into actionable business insights. Follow this guide to use tools to make data-driven decisions that significantly impact retail performance using POS Systems.

Accessing Your POS Gold Mine

Your point-of-sale (POS) system has a Gold Mine of data. Here's how to access your sales comparison reports:

  1. Open your POS software and navigate to the Reports section.
  2. Select the Sales option.
  3. Look for the Compare feature to analyse different periods side by side.


Point of sale menu selection for compare


Setting Up Your Comparison: The Foundation of Insight

Options to compare periods

When setting up your comparison, you have two main options:

  1. Formal Date Ranges: Use standard periods like months or quarters for consistent reporting.

  2. Custom Date Ranges: Select specific dates (e.g., 06 Nov 2024 to 05 Dec 2024) for more targeted analysis.

Pro Tip: Choose comparable periods for meaningful analysis. For example, compare:

  • This year's holiday season to last year's
  • This quarter to the same quarter the previous year
  • Weekends vs. weekdays

By selecting similar business cycles, you'll gain the most accurate insights into your performance trends.

Analysing the Report: Your Retail Crystal Ball

Comparison reports

Your comparison report offers a wealth of information:

Overall Performance Metrics

  • Sales figures for each period
  • Revenue generated
  • Quantity sold

Department-Specific Insights

  • Performance comparisons across departments
  • Individual department deep-dives

Pro Tip: To analyse specific departments more thoroughly, click on them in the left-hand menu.

Understanding POS Data Export: Unleashing the Power of Excel

Export to excel

To gain additional insights, export your data to Excel. Follow these steps:

  1. Click the export button in the top left corner of the report.
  2. Choose Excel as your export format.
  3. Open the file in Excel or OpenOffice (a free alternative).

Once you've got your data in Excel, you can dig deeper.

Actionable Insights from Reports: Beyond Sales Comparisons

Your POS system is a goldmine of retail intelligence. Beyond sales comparisons, consider exploring these powerful reports:

  • Top-selling products analysis: Identify your star performers and potential areas for expansion.
  • Inventory turnover tracking: Optimise stock levels and reduce carrying costs.
  • Customer purchase history: Tailor your marketing and loyalty programs for maximum impact.
  • Staff performance metrics: Improve scheduling and identify training opportunities.

Turning Data into Dollars: From Insight to Action

Now that you've gathered insights from your POS reports, it's time to put them into action:

Identify top performers

Optimise the placement of your best-selling products in your store layout.

Adjust inventory

Use turnover data to fine-tune stock levels, reducing overstock and stockouts.

Refine marketing

Leverage department performance comparisons to allocate your marketing budget effectively.

To consistently enhance your retail performance, regularly examine your data, experiment with new strategies, and evaluate the outcomes.

Your Next Moves: Turning Data into Profit

Start harnessing the power of your POS data today:

  1. Generate a sales comparison report for the last two months.
  2. Identify your top three performing products or departments.
  3. Create one actionable strategy based on your findings.
  4. Execute your strategy
  5. Monitor the outcomes.

Your POS system can be your gateway to success in retail.

Frequently Asked Questions

Q: How do I access sales comparison reports in my POS system?

A: To access sales comparison reports:

  1. Open your POS software
  2. Navigate to the Reports section
  3. Select the Sales option
  4. Look for the Compare feature to analyze different periods side by side

Q: What types of date ranges should I use for comparisons?

A: I suggest using formal date ranges, such as monthly ones. Custom date ranges (e.g., 06 Nov 2024 to 05 Dec 2024) are for ad hoc analysis.

Q: What key information can I find in a sales comparison report?

A: Sales comparison reports typically provide:

  • Overall performance metrics (sales figures, revenue, quantity sold)
  • Department-specific insights
  • Performance comparisons across departments

Q: How can I analyse my POS data more in-depth?

A: Export your data to Excel or a similar spreadsheet program. This allows you to perform custom calculations and create tailored data visualisations.

Q: Beyond sales comparisons, what other reports should I explore in my POS system?

A: Consider exploring reports on:

  • Top-selling products
  • Inventory turnover
  • Customer purchase history
  • Staff performance metrics

Remember, consistent analysis and action based on your POS data are key to optimizing your retail operations and boosting your bottom line.

Add new comment

Restricted HTML

  • Allowed HTML tags: <a href hreflang> <em> <strong> <cite> <blockquote cite> <code> <ul type> <ol start type> <li> <dl> <dt> <dd> <h2 id> <h3 id> <h4 id> <h5 id> <h6 id>
  • Lines and paragraphs break automatically.
  • Web page addresses and email addresses turn into links automatically.
CAPTCHA This question is for testing whether or not you are a human visitor and to prevent automated spam submissions. Image CAPTCHA
Enter the characters shown in the image.

A useful report for the Christmas season

POS SOFTWARE

Christmas stock

Poor inventory management has been shown to cause retail businesses to lose up to 30% of potential sales during the Christmas rush. With only a slight delivery delay and unpredictable buying patterns, maintaining optimal stock levels becomes a challenge for retailers. Mirror marketing offers a proven solution to these challenges.


Enhancing retailer inventory management over the holidays

Understanding Mirror Marketing

Mirror marketing is a proven methodology for inventory management. It compares historical sales data with current inventory, which helps retailers maintain optimal stock levels. It identifies potential stock gaps before they become problems, ensuring you're well-prepared for upcoming sales periods. For example, a retailer can compare last December's hot-selling items against current stock levels to prevent shortages of popular gift items.

The foundation of mirror marketing lies in its systematic use of historical data analysis. Industry data shows retailers implementing mirror marketing achieve an average 25% reduction in stockouts during peak seasons.

The Power of Historical Comparison

Recent studies have shown that nearly half of all retailers experience significant stock shortages during Christmas. However, historical data analysis has proven to improve forecast accuracy by up to 40%. Most importantly, retailers who properly manage their inventory through mirror marketing techniques have reported increased holiday sales.

Mirror marketing helps identify items popular during previous periods but not currently selling - often because they're out of stock rather than due to decreased demand. This insight is invaluable during the holiday season when customer demand fluctuates dramatically.

Implementation Strategy

Setting Up Your Reports

Now, here is a step-by-step method for doing it.

Go to Register Reports marked in green.

Register reports selection

Now select in stock, "Stock Sold During Period(a) Not Sold in Period(b)"

Stock not sold

The report tells us what was sold in a previous period (a) last year but has not sold in this period. The reason often is you have run out of some stock lines.

So we put in the dates for the last seven (7) days of the previous year.
Then we put in the dates to compare with last week.

You will now be confronted by many different options, but let us keep it simple, so ignore them and run the report. Check the report showing the listed stock lines.

Monitoring and Analysis

Successful implementation requires consistent weekly inventory analyses and daily monitoring of trending items during peak seasons. Maintaining detailed historical records and acting on report insights within 24 hours of generation prove essential.

Holiday Season Strategy

The Christmas period demands increased vigilance in inventory management. Daily report checks are often necessary to capture seasonal trends effectively.

"Retailers using mirror marketing during peak seasons typically see a terrific improvement in stock availability and an increase in sales conversion rates."

Success Metrics and Implementation

Implement these mirror marketing strategies to transform your holiday inventory management today. Proper planning and systematic monitoring will help ensure a successful Christmas season.


Frequently Asked Questions About Mirror Marketing

Q: What is mirror marketing?

A: Mirror marketing is an inventory management methodology that compares historical sales data with current stock levels to optimize inventory. It helps retailers prevent stockouts by analyzing past sales patterns to predict future demand.

Q: What is the difference between Order Management Systems and inventory management?

A: Order Management Systems and Inventory Management serve different purposes:


Feature Order Management Systems Inventory Management
Primary Focus Customer orders and fulfillment Stock control and warehouse operations
Main Goal Customer satisfaction and order processing     Inventory optimization and stock-level management
Time Orientation    Present-focused (current orders) Present and future-focused (forecasting)
Key Functions Order processing, tracking, fulfillment Stock monitoring, replenishment, warehouse management 


Q: How effective is mirror marketing for retail businesses?

A: Mirror marketing has been shown to reduce stockouts by approximately 25% during peak seasons and can help prevent up to 30% loss in potential sales during Christmas.

Q: What reports do I need to run for mirror marketing?

A: To implement mirror marketing, you need to:

  • Access Register Reports
  • Select "Stock Sold During Period(a) Not Sold in Period(b)"
  • Compare the previous year's data with the current period
  • Review stock lines that show discrepancies

Q: How often should I run mirror marketing analyses?

A: For good results:

  • I recommend every week over Christmas
  • Review reports immediately as the information is current 

Q: Can mirror marketing improve holiday season sales?

A: Yes, retailers using mirror marketing during holiday seasons typically experience:

  • Improved forecast accuracy
  • Better stock availability
  • Increased sales conversion rates

Q: What are the key benefits of mirror marketing?

A: The main advantages include:

  • Prevention of stock shortages
  • Early identification of potential inventory gaps
  • Improved seasonal sales performance
  • Better prediction of popular items

Q: How do I get started with mirror marketing?

A: To begin implementing mirror marketing:

  1. Create regular monitoring schedules
  2. Act on insights immediately

Q: Is mirror marketing suitable for all retail businesses?

A: I cannot see why not, as mirror marketing can benefit any retail business that:

  • Experiences seasonal sales fluctuations
  • Maintains inventory records
  • Has at least one year of historical sales data
  • Wants to optimise stock levels


Add new comment

Restricted HTML

  • Allowed HTML tags: <a href hreflang> <em> <strong> <cite> <blockquote cite> <code> <ul type> <ol start type> <li> <dl> <dt> <dd> <h2 id> <h3 id> <h4 id> <h5 id> <h6 id>
  • Lines and paragraphs break automatically.
  • Web page addresses and email addresses turn into links automatically.
CAPTCHA This question is for testing whether or not you are a human visitor and to prevent automated spam submissions. Image CAPTCHA
Enter the characters shown in the image.

How to use your data to have better stock control

POS SOFTWARE

Stock trends

We are all balancing inventory—excess stock ties up capital, while insufficient stock can result in lost sales opportunities.

Balancing inventory levels

Here is a simple key to improving your stock control that is available now, and it will boost your bottom line.

Understanding the Power of Historical Data

Big suppliers don't just guess about stock control—they rely on historical data. They compare monthly sales year over year to identify trends and patterns. They tend to use 24 months of your data, which helps them account for seasonal fluctuations and make more accurate predictions.

But with a modern POS system, you've got all the tools you need to play in the big league.

Why Your POS Data is Gold

Your POS system isn't just for processing transactions, it full of valuable information. Here's why it's better for you than your supplier's information:

Real-time sales data

Unlike your suppliers, who only see what you've ordered, your POS system shows exactly what you've sold.

Seasonal insights

By comparing data from the same months across different years, you can spot seasonal trends specific to your business.

Stock level optimisation

With accurate sales data, you can decide how much stock to hold.

How to Use Your POS Data for Better Stock Control

Let's walk through a practical example of how you can use your POS data to improve your stock control:

Access your sales report

You'll find this under 'Reports'> 'Sales'> 'Stock Sales Details 24 Month Trend'.

Filter your data

For this exercise, we'll keep it simple:

Exclude inactive stock Filter by department or supplier

Look for patterns in your sales data. Are certain items consistently selling well? Do some products have seasonal spikes?

Evaluate stock levels

Compare your current stock levels with your average monthly sales. Do you need to be more overstocked on slow-moving items?

Case Study: Spotting Overstock Issues

Let's look at a couple of examples from our report:

Product A

Average sales: 2 per month Current stock: 6 units Stock cover: 3 months. If you can reorder this product weekly, holding three months of stock might be excessive. Consider reducing your stock levels to free up capital.

Product B

Average sales: 0.5 per month (1 every two months) Current stock: 16 units Stock cover: 32 months (nearly three years!) This is a clear case of overstocking. Unless there's a specific reason for holding so much stock (like a bulk discount or upcoming promotion), you should look at significantly reducing your inventory of this item.

Turning Insights into Action

Now that you've got this knowledge, here are some steps you can take:

Adjust your reorder points

Use your sales data to set more accurate reorder points for each product.

Negotiate with suppliers

Armed with solid data, you can better negotiate order quantities and frequencies with your suppliers. In my experience, most suppliers will listen to you if you have an issue.

Plan for seasonality

If you spot seasonal trends, plan your stock levels accordingly.

Clear out, slow movers.

Identify products that aren't selling well; now you have something to think about and what to do with them.

Focus on your winners

Make sure you're well-stocked with these winners.

The Bottom Line

Leverage your POS data; don't guess. Make informed decisions about your inventory. This approach can help you: Reduce tied-up capital Minimise storage costs Avoid stockouts of popular items With your cash flow

Your POS system is a powerful tool that gives you the information you need to compete.

Our POS software makes it easy to access and analyse sales data.

Contact us to learn how we can help you optimise your stock control and boost your profits.​


Add new comment

Restricted HTML

  • Allowed HTML tags: <a href hreflang> <em> <strong> <cite> <blockquote cite> <code> <ul type> <ol start type> <li> <dl> <dt> <dd> <h2 id> <h3 id> <h4 id> <h5 id> <h6 id>
  • Lines and paragraphs break automatically.
  • Web page addresses and email addresses turn into links automatically.
CAPTCHA This question is for testing whether or not you are a human visitor and to prevent automated spam submissions. Image CAPTCHA
Enter the characters shown in the image.