
It is nice to have a fast hard drive but the ultimate and most important question is how reliable is that hard drive going to be over the next few years. If the hard drive goes down its a major problem. Its one many of us have experienced. You switch on the computer in the morning, and it does not work. You talk to whoever is responsible for your hardware and you are told, I am sorry, but we need to replace your hard drive. If you are lucky, they can copy what is on there and set it up, if not then everything has to be replaced. If people do not have backups, it can be a disaster. We have had to fly a broken hard drive to Perth to a company that fixes damaged hard drive in an attempt to get the information off it because they had no backups.
Now how likely is this to occur? This may help you as it is a study here [Link removed by website] by an organisation which runs about 90,000 hard drives.
The first point is noticeable is that not all hard drives are the same. The failure rates depend much on the manufacture. The next point is that as a rule, you can see the bigger the hard drive the more reliable it is, this is probably because it is a better drive and so almost certainly more expensive.
The best quarter they ever had for hard drive failures was the last, and it was 1.84% failures per quarter. Now the first point to consider is that these people are running their hard drives in a controlled enviroment where the temperature, humidity and electricity are strictly controlled. Few of us do that! So our figures will be much worse but let us run with their values.
So a typical user of ours has on their point of sale system a server and two workstations.
If the workstation goes down, its typically a pain and a problem. If a server goes down, with a regular hard drive the system just stops.
So how often can we expect a problem because of this? Well as there is three computer altogether. The failure rate of at least one hard drive out of three going down a quarter at 1.84% is 5.4% a quarter. This is what the graph shows.
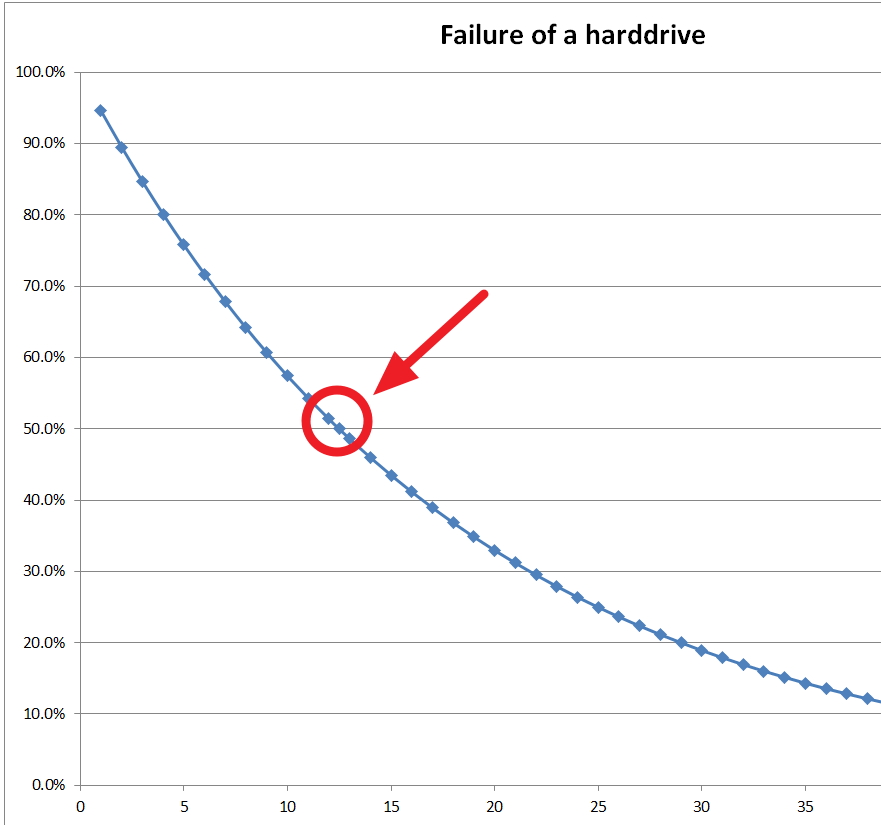
That point circled is in the 12.5 quarter so about once every three to four years one can expect such a problem conservatively. We would class about a third of these failures, as its a server as very serious.
If you want to check out my spreadsheet for this graph, it's available here.
 Download

