
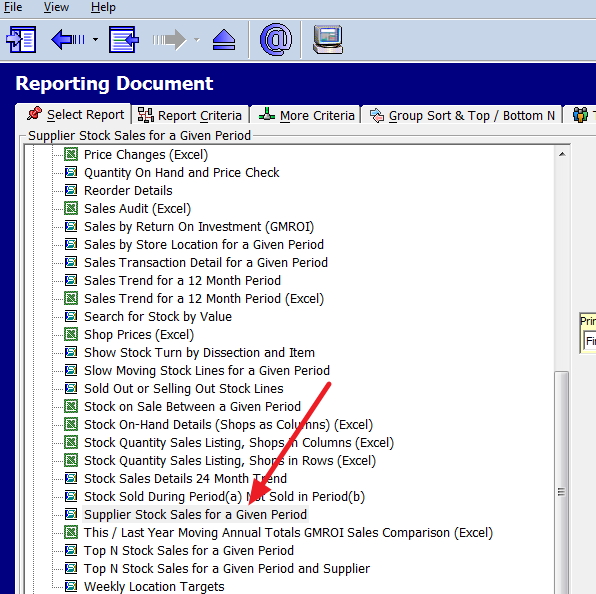
Here is a step by step guide to using the preview to show you the power of it.
The report I will be working though is Supplier Stock Sales for a Given Period.
You will find it here, marked with a red arrow.
Now for this demonstration, I picked a large period and out popped a report showing a summary of sales by quantity, sales, profit, etc. for each supplier.
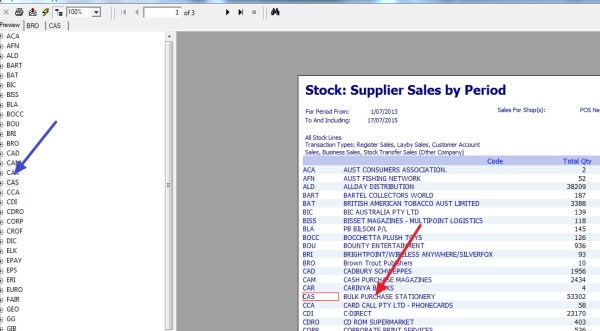
Now as you can see some of these have large figures, so let us say I want to look at Bulk Purchase Stationery. Currently I can either click with the mouse on the left side under the preview (marked in blue), or I can directly click on the right (marked with a red arrow). The advantage of the blue is its often easier to find.
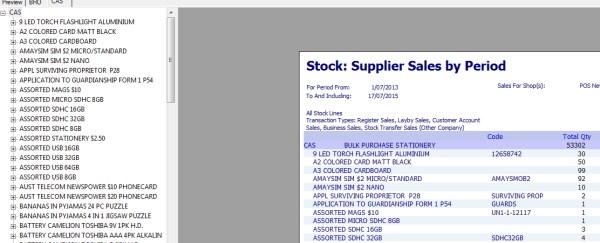
Once I click on this suppler out pops a drill down, where you can see exactly what was sold by that supplier. I can then drill down to where the sale was made (location), or I can export to excel, or word if I want to.
This is just one example of the smart reporting tools only available to our clients, which allows themto check the performance of their suppliers.

