
Since my last post on Economic Ordering Quantity (EOQ) here, I've got a few questions. Many wanted more details on how to do the calculations for their shop. Since there is interest, I made a comprehensive reply here to explain it fully; that way, I can answer in mass.
Please remember that this requires information from your POS System, some technical skills and access to either Excel or OpenOffice (which are free, by the way).
Why EOQ Matters
Before we dive into the nitty-gritty, let's discuss why EOQ is special. It's a scientific way to manage your business to help you achieve maximum profitability by looking at the real world, where the stock cost goes beyond just the price of an item by the supplier. It addresses how often you should order stock from a supplier (Stock optimisation).
Now, if you buy too much, and it sits on your shelves:
- It then takes up valuable space
- Suffers from shoplifters
- Tying up your overdraft.
etc
Conversely, on the flip side:
- Not buying enough can cost you sales.
EOQ is designed to find the sweet spot between these two problems.
The EOQ Formula
Here's the formula used that mathematicians looking at the problem found:
Number of times to order = SQR(2 x D x k / h)
Where:
- D is the ordering quantity of the item
- k is the cost of ordering
- h is the holding costs
I know our system isn't designed to handle this calculation directly, and the reasons will become clear why not here, but we've got a nifty ad-hoc reporting system that can do it, and it's a great way if you work through this of the power of our Ad-hoc reporting. Trust me, it's worth learning how to use it the Ad-hoc reporting. I think you'll be amazed at the power you have in your Point of Sale Software now.
How to get your EOQ
I never said it would be easy, only that it's a worthwhile exercise.
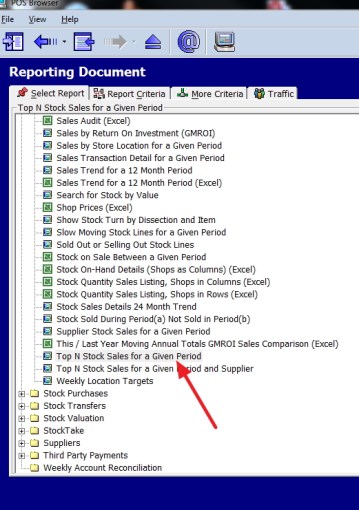
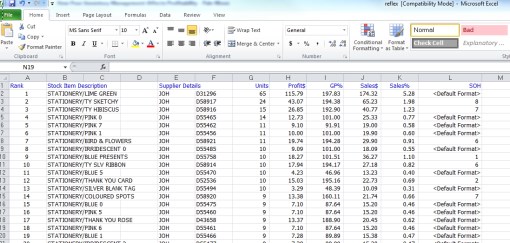
Go to register reports and select the top stock report, which is marked with the red arrow here.
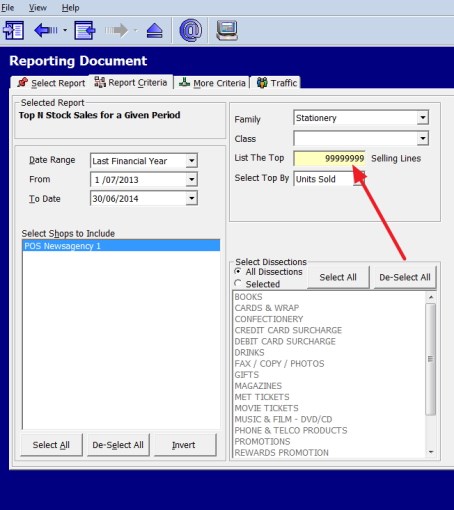
Now, select your criteria; I used the stationery department because it's a simple department that most people could relate to. Furthermore, the note marked in red indicates that I put 99 million in for the number of items needed to get everything. I also picked a whole year, as small periods can have fluctuations that can muck up the long-term trends.
Now I have this report.
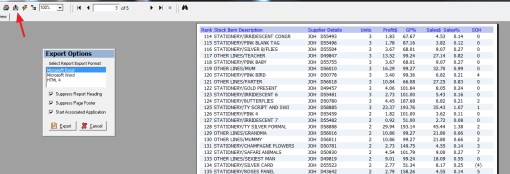
I imported the data into Excel, as shown here with the red arrow.
This then produced for me an Excel spreadsheet of my report.
That is the standard report, but now, I can change it to almost anything I want—ad hoc. This is the report I changed it to. Click on it for more details, and I will now explain how I did it.
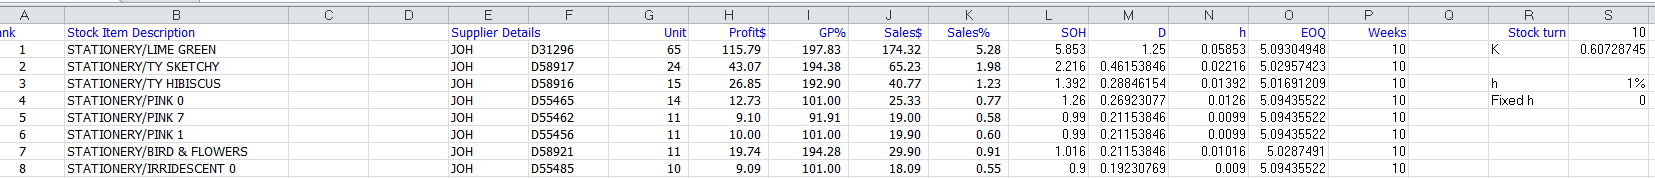
In my Excel spreadsheet, you will see that I have put all my variables on the right, so I can play with them later.
The first variable I need is D, which is the ordering quantity of the item. I have that here as units, so that problem is solved. All I need to do is divide it by 52 weeks a year, so column M2 =G2/52, and I copy it down.
I have to determine the cost of ordering. It takes the department about two hours for someone to process an order and another hour to process the order when the goods come. Say three hours plus some extras, say about $150. Since I have 247 items in this department, that works out, too.
k = $150/247 = 0.60728745
Now, we need the holding cost (h), which is the holding cost.
I explained how I get my stock-turns here, and it's 10 for this stationery department.
I would say for a year, we are looking at the interest of money plus shoplifting of about 1.5%, so say about 14%, so per week, that works out to 14%/52 weeks a year, about .2%, plus there is a rental on the building. This is something you need to determine. I suggested before that you go to your last year's profit and loss to resolve this. What is the cost of the space that you require to sell an item? When they do this, many report to me how stunned they were just how high that figure is. In this case, as I do not know it, I am setting it to zero.
Now, I need the stock on hand. I could use the figure that is there, but it suffers from the short-term fluctuations I mentioned above, so I prefer to use the yearly figure. I need to subtract the profit from the sales and divide it by the stock turns.
So, I make a formula (Sale$-Profit$)/stock turn in this Excel sheet, which is =(J2-H2)/$R$1, my SOH figure.
My h is now (SOH) x h + Fixed h, and you can see the column there marked N.
Now, my EOQ is easy to determine as it =SQRT(2*M2*$S$2/N2) and copy that down.
Since I am working in weeks, I did that 52 weeks and divided it by my EOQ.
The formula suggests that I should look at it every two or three months, which makes sense as stationery is a small department in this store with sales of about $3000 annually. However, there are certainly more important departments that the shop should investigate.
Now, I would change the figure, increase or decrease the stock turns, the holding costs, etc., to see what happens.
Common Mistakes When Implementing EOQ
Although EOQ is a valuable tool, there are some problems people commonly come up with when trying to use it:
- Ignoring variability: It assumes constant demand, which often needs to be corrected, e.g. Xmas stock or Mother's Day stock.
- Overlooking many costs: You need to include all the ordering and holding costs, including some less obvious ones like breakage and obsolescence.
- Not updating regularly: As market conditions and costs change, you must periodically review your EOQ calculations; I suggest yearly.
- Perishable goods: It assumes that all items do not perish or have a marketing cycle, e.g. A magazine is monthly, and milk cannot be kept.
- Forgetting about lead times: It does not account for supplier lead times, particularly for items ordered from the net.
- Neglecting order quantity: It assumes you can order as little as you require; some suppliers have minimum orders.
- People's natural rhythm: People can be instructed to do the task once a week, every two weeks, or monthly, but it's a bit hard to tell then every 12 days. We do live in a real world.
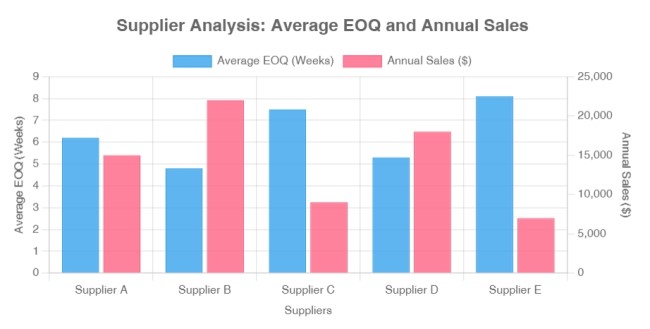
- Often shops tend to have to do it by supplier not department: When you start to break down the figures to smaller sections of the shop you get results all over the place.I got this when I looked by suppliers, where you can see the problem.
I suggest that you keep it simple and do it by department.
Wrapping Up
Remember, good inventory management isn't just about crunching numbers. It's about ensuring profitability is not sacrificed due to poor procedures. This is just one piece of the puzzle.
If there's enough interest, I will do a webinar on this topic and incorporate it into our software. So, let us know what you think!
Did you try to calculate EOQ for your shop? Please tell me what you found. I'm interested in hearing about your experience. Your practical experience is valuable to us, whether you have any questions or just want to share your thoughts.
Frequently Asked Questions (FAQ)
Here is an FAQ to answer some of your questions on the topic
Q1: What is Economic Ordering Quantity (EOQ)?
A: EOQ is a scientific method used to determine the optimal quantity of inventory to order for the most profit.
Q2: Why is EOQ important for my business?
A: EOQ helps maximize profitability by finding the sweet spot between overstocking (which ties up capital and space) and understocking (which can lead to lost sales).
Q3: Where can I learn more about implementing EOQ in my business?
A: Links above were supplied, the Wikipedia has a decent article too here.
Q4: Do I need special software to calculate EOQ?
A: No. While specialized software can help, you can calculate EOQ using Excel or OpenOffice spreadsheets using your POS System.
Q5: How often should I recalculate my EOQ?
A: As market conditions and costs change, you should review and update your EOQ calculations. I think yearly should be enough.
Q6: Can EOQ be used for all types of inventory?
A: I think even if it is not applicable, the figures it produces, even if you have perishable goods or items with very short marketing cycles, are interesting.
Q7: How does EOQ relate to my Point of Sale (POS) system?
A: Many modern POS systems are required to provide the information needed for EOQ calculations.
Q8: Is EOQ the only inventory management method I should use?
A: No, EOQ is one tool among many.
Q9: Is this EOQ the only inventory formula for this use?
No, the EOQ formula has many variations, some of which might suit you better. Please let me know if you find one that you think is better.

