
We’ve just launched a big update to our POS System’s AI reporting: the Commercial Operations Profile (COP). This new feature will make your AI reports much more useful. The COP gives a quick overview of your shop, including your location, traffic patterns, what brings people in, profit categories, customer types, competitors, operational limits, and growth goals. With this, your AI business analyst gets the context it needs to understand your business.
Let me explain. If you printed a POS report and showed it to a bank manager, accountant, or business analyst like me, they could read the numbers, but without knowing what your business does, the figures wouldn’t mean much. For example, selling five dog toys might be insignificant for a supermarket but great for a small kiosk near a train station. The COP adds this context. It turns your POS System’s AI from a simple calculator into a strategic adviser, helping it explain what your numbers mean for your shop, your customers, and your profits.
Info: Without the COP, the AI just gives you numbers. With the COP, your POS System provides tailored, realistic retail analysis every time.
The Reality of Retail Reporting Today
After years of working with independent Australian retailers, I know what the end of the month looks like. You find a quiet moment, sit in the back office, and open a spreadsheet or POS report. You see what you sold, but the data doesn’t clearly show what you should do next.
Recently, Artificial Intelligence (AI) promised to change all of this. Retailers were told that AI could look at their sales data and magically offer brilliant business advice. However, many who have tried asking the current AI for help have been disappointed. All they got was a textbook answer, typically "run a 50% off storewide sale" or "hire a social media manager." Those answers are useless for most analyses.
Now, why does this happen? Well, the simple answer is: there is no business context. Yes, the AI can summarise numbers, but it cannot explain what they mean. Until now, you had to manually add business context each time you wanted a deeper analysis. If you tried with AI, you had to type out your entire store history to get a good answer.
Our new AI POS reporting software changes everything. You now create a form for your business. You save it in your system, and it acts as your personal space.
Why Your POS System Needs a Commercial Operations Profile (COP)
A good AI retail software needs to understand the physical reality of your store. Here are five reasons why the Commercial Operations Profile turns basic reports into powerful POS business intelligence.
1. It Understands Your Normal Baseline
Raw data lacks context. Let's say a generic AI looks at your sales report. It notices that your "Greeting Card" sales dropped by 15% in February. The AI will immediately flag this as a major business failure and tell you to panic.
However, if your COP states that your store is located in a coastal holiday town, the AI understands the bigger picture. It knows you have a massive transient tourist population in January. Therefore, the AI realises that a drop in February is a normal seasonal baseline return. It is not a crisis. It will tell you that your sales are perfectly on track for the season.
2. It Focuses on Profit, Not Just Foot Traffic
An AI analysing a spreadsheet will naturally focus on the biggest numbers. If selling Lotto makes up 60% of your top-line revenue, an unguided AI will tell you, "Lotto is your most important category. Dedicate more floor space to it."
As an experienced retailer, you know this is terrible advice. The profit margins on Lotto are tiny. The COP explicitly separates your "Footfall Drivers" (what brings people in) from your "Profit Drivers" (what actually pays the rent).
When the AI reads your sales report now, it looks through a profit lens. It will give you actionable advice, like: "Your Lotto traffic was up 10% this week, but your premium gift sales remained flat. You are failing to convert that extra foot traffic."
3. It Highlights Cross-Selling Failures
When you look at basket-size data in your POS dashboard, you need to know what should be happening. This helps you spot what is not happening.
For example, your shop might act as an Amazon or Australia Post parcel collection point. That is a great footfall driver. If your COP lists your target cross-sell as "Parcel pickup + Greeting Card," the AI will specifically scan your transaction report looking for that exact combination.
It can then report back: "Only 2% of parcel customers bought a card this month. The counter-placement strategy is not working. Try moving the card spinner closer to the parcel pickup zone."
4. It Respects Your Operational Limits
Standard retail analytics software assumes you have unlimited resources. If an AI notices that Friday afternoons are your most profitable time, it might suggest, "Double your staff on Friday afternoons to capture more sales."
That is useless advice if you run a small family business. If your COP clearly states your constraints—such as "Owner-operated, no additional staff budget"—the AI adapts its analysis.
Instead of suggesting more staff, it will offer a practical solution: "Since you cannot add staff on Fridays, you must streamline your checkout operations. Pre-bundle your top-selling Friday items to speed up the queue."
5. It Aligns Data with Your Strategic Goals
A modern point-of-sale system captures hundreds of metrics every day. Without direction, the AI does not know which numbers you actually care about right now.
Because the COP includes your "Top 3 Goals" (for example, growing your parcel-to-purchase conversion rate), the AI prioritises that specific metric. It will ignore distracting data points, like a slight dip in newspaper sales, to keep you focused on your main objective.
How to Build Your Commercial Operations Profile
To help you create your COP quickly, we have built a simple questionnaire. To answer it, you do not need to look up exact numbers. A decent estimate is perfectly fine. It does not take long, one of the retailers using our newsagency POS software told me it took him eight minutes to complete the questionnaire.
Please take a few minutes to answer the questions below. I suggest you copy and paste this list into a blank document, then fill it out under each question.
Section 1: Business Identity and Premises
First, we need to establish the physical asset.
- Trading Name: What is the name on your door?
- Full Address: Include your suburb, state, and shopping centre name if applicable.
- Business Structure: How many years have you been in operation? Is it owner-operated or managed?
- Building Type: Select one: Strip shop / Internal shopping centre / Stand-alone building / Kiosk.
- Positioning and Visibility: Are you a corner site, an end-cap, middle of the run, or right next to an entrance?
- Visibility Assets: What draws the eye from the street? Do you have glass frontage, clear counter sightlines, or large window signage?
- Lease Status: What is your tenure? (For example, 3+3 years remaining).
Section 2: Location and Traffic Mechanics
Next, we define how people move around your store.
- Traffic Flow: Is your shop in a "high-flow" path where passing traffic is guaranteed? Or are you a "destination" location where customers must make a specific effort to find you?
- External Anchors: List the top three nearby drivers bringing people to your area. This could be a Woolworths, a train station, a post office, or a popular cafe.
- Immediate Neighbours: Who is immediately to your left, right, and opposite?
- Peak Trading Windows: What are your busiest days of the week and busiest hours of the day?
- Quietest Periods: What days and times are consistently dead?
Section 3: The Revenue Engine
This is the most critical part. We must separate traffic from profit.
- Top Footfall Drivers: List the top three to five items or services that physically bring the most people in. Include them, even if they are low-profit (for example, Lotto, parcels, newspapers, or transport cards).
- Top Profit Drivers: List the top three to five categories that generate your highest gross profit dollars. Think about greeting cards, premium gifts, printer ink, or educational toys.
- Category Trends: Which categories in your store are currently growing, and which are declining?
- Common Cross-Sells: What items do customers frequently buy together? (For example, "Parcel pickup + greeting card").
Section 4: The Customer Base
An AI needs to know exactly who it is talking to.
- Traffic Split: Estimate the percentage of your customers. Are they Regular Locals (%), Passing Transients (%), or Centre Staff (%)?
- Top 3 Customer Personas: For each, detail who they are, what they buy, and when they come in. For example: Persona 1: Elderly locals buying newspapers and Lotto on Saturday mornings.
Section 5: Digital Footprint and Promotions
We need to establish your current marketing baseline.
- Google Business Profile: Do you have one? What is your approximate star rating and review count?
- Social Media: Which platforms do you use, and how often do you post?
- Website/E-commerce: Do you sell online? What platform do you use?
- Customer Database: Do you collect emails or SMS numbers? What is your approximate list size?
- Promo History: What specific promotions, bundles, or loyalty offers have worked well in the past? What failed?
Section 6: Operations, Competition, and Goals
Finally, we set the AI's boundaries.
- Operational Setup: What point of sale system do you use? Are there any major bottlenecks in your inventory processes?
- Constraints: Do you have strict limits regarding staff capacity, marketing budget, or shopping centre rules?
- Local Competitors: List your top two local competitors for your high-margin items. What specific advantage do they have? (For example, "Officeworks beats us on ink range").
- Top 3 Business Goals: What are your primary targets for the next 90 days? (For example, increase average basket size).
The Secret to Great AI COP
Once you have answered these questions, you should not just paste your conversational answers directly into your POS System, as some suggest; there is a much better way to do it. AI programs do not behave as humans do. To get the AI to perform perfectly, the output needs to be in what we software engineers call dense data-point formatting.
This means stripping away all grammar, conversational padding, and full sentences. We present the raw facts as compactly as possible.
Here is a clear example of the difference between human writing and computer formatting:
Narrative Formatting (How humans write and read):
"The store is a stand-alone building located on a busy corner. It gets a lot of foot traffic from the local train station every morning between 7 am and 9 am. Because of this, our biggest seller by volume is newspapers, but we don't make much money on them. We make most of our profit from selling premium Hallmark greeting cards."
This is 57 words. This has a high word count but not much actual data.
Dense Data-Point Formatting (How AI likes to read):
Premises: Stand-alone, corner position.
Key Anchor: Train station.
Peak Traffic: 7:00 am - 9:00 am.
Footfall Driver (High Volume): Newspapers.
Profit Driver (High Margin): Hallmark greeting cards.
This is only 28 words. We have a much lower word count, but we deliver the same information with perfect clarity.
Formatting your COP this way gives you two major advantages.
Memory space
It saves memory space. AI models have a limited working memory. Your COP must be short and sharp. Ideally, it should be between 300 and 500 words. The shorter and denser it is, the more "brainpower" the AI has left actually to analyse your sales reports.
AI hallucinations
This is the most important, as it reduces AI hallucinations. Have you ever noticed your AI making things up or guessing wildly? We call these "hallucinations." This usually happens because the AI gets confused. Strict data-point formatting creates absolute clarity. It forces the AI to stick to the facts you provided.
The Magic Prompt to Generate Your Profile
You do not need to write this type of dense format yourself; in fact, I recommend that you use a free AI tool (like ChatGPT or Gemini) to translate your human answers into computer-friendly data.
Copy the prompt below, paste it into your AI tool, and paste your filled-out questionnaire answers right at the bottom.
Role: Act as a Senior Retail Analyst.
Task: Analyse the provided Business Owner Questionnaire data and generate a highly accurate, concise Commercial Operations Profile (COP).
Formatting Rules: Output must be strictly under 2,000 characters (approx. 300 words). Use dense data-point formatting (e.g., Key: Value). Do not use introductory or concluding paragraphs. Eliminate all conversational filler. Use Markdown headers and bullet points.
Structure: Provide a structured summary of: 1) Business Identity & Premises, 2) Location Mechanics & Traffic, 3) The Revenue Engine (Highlighting the Gap between Footfall vs Profit), 4) Customer Personas & Digital Health, 5) Competitors & Operational Constraints, and 6) Top Growth Opportunities based on their stated goals.
Input Data:
[Paste your completed questionnaire answers here]
What Your Final Profile Will Look Like
When you hit enter, the AI will spit out a beautifully clean profile. Here is a sample of what the final COP looked like in a test store. I created Parkmore Newsagency. Notice how clean and sharp the data is.
Commercial Operations Profile: Parkmore Newsagency
1) Business Identity & Premises
- Trading Name: Parkmore Newsagency
- Address: Parkmore Shopping Centre (internal)
- Structure: 5 years, owner-operated
- Positioning: Middle-of-run, quiet section. Glass frontage is the only visibility asset.
- Lease: 2+3 years remaining
2) Location Mechanics & Traffic
- Flow: Mixed (some passing + destination)
- Anchors: Coles, Woolworths, Post Office
- Neighbours: Left – doctors surgery. Right – discount shop. Opposite – women's dress shop.
- Peak: Saturday mornings
- Quiet: Monday afternoons
3) The Revenue Engine
Gap: High-footfall/low-margin (Lotto, magazines, stationery) vs. high-margin/low-traffic (greeting cards, gifts).
- Footfall drivers: Lotto, magazines, basic stationery.
- Profit drivers: Greeting cards, premium gifts, high-end stationery.
- Trends: Gifts are growing. Magazines are declining.
- Cross-sells: Lotto + gifts. Gifts + greeting cards.
4) Customer Personas & Digital Health
- Traffic Split: 45% regular locals | 50% passing transients | 5% centre staff.
- Personas:
- Elderly idle walkers (buy Lotto and magazines).
- 35-year-old mums with kids (doing the weekly grocery shop).
- 45-year-old women shoppers (looking for quick gifts).
- Digital Health: Google 3 Stars (4 reviews). Facebook 1x/month. No website or customer database.
- Promos: Christmas/Easter only (no proven winners yet).
5) Competitors & Operational Constraints
- Key Rival: Nearby Dollar Store (beats us on card price, but has inferior quality).
- Constraints: Marketing budget is severely limited. Centre management bans coffee sales.
- Operations: Stable POS System, no inventory bottlenecks.
6) Top Growth Opportunities (Tied to Goals)
- Drive gift sales via existing cross-sells (bundle Lotto with gifts).
- Convert the 50% passing transient traffic on Saturday peaks into higher-margin basket sales.
- Target the elderly and mum personas with quality card bundles to avoid a price war with the dollar store.
- Quick digital wins: Boost Google reviews, increase Facebook frequency, and capture emails at the till.
The Final Step: Putting Your Retail Analytics Software to Work
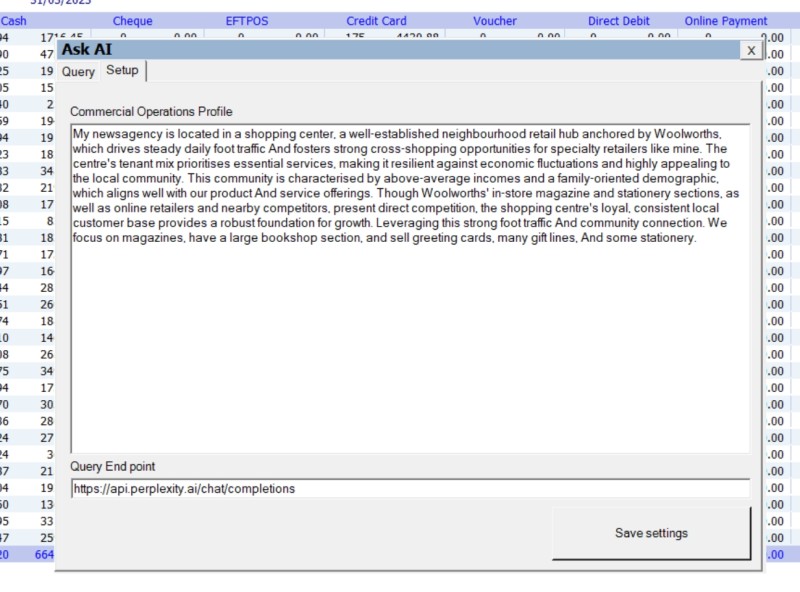
Once you have your clean, dense profile, review it to ensure everything looks correct. If it has errors, you are asking for trouble. Now log into your POS System and paste that final profile directly into our AI reporting settings.
Once your COP is saved, you are ready to go. Run an end-of-month sales report and ask any specific business question.
For example, you can ask: "Based on my profile, why did my profit margin fall this month, and what low-cost actions should I take next week to fix it?"
You can also ask it for daily operational help: "Based on my peak traffic times and staffing constraints, write me an optimal staff roster for next week."
You will be amazed by how incredibly useful, realistic, and profitable the answers become. Once your AI truly understands your retail business, there is no limit to the insights you can discover. It stops being a calculator and starts being a true business partner.
If you are tired of generic advice and want a system that actually helps you grow, you need the right tools. Suppose you want to see exactly how our new AI POS reporting software can transform your business. Let's get your technology working harder, so you can focus on making sales.
Written by:

Bernard Zimmermann is the founding director of POS Solutions, a leading point-of-sale system company with 45 years of industry experience, now retired and seeking new opportunities. He consults with various organisations, from small businesses to large retailers and government institutions. Bernard is passionate about helping companies optimise their operations through innovative POS technology and enabling seamless customer experiences through effective software solutions.

