
The comparison of where your customers go in your shop and where they buy can be a very useful procedure can be a very useful exercise in a shop. Ideally the two should be in alignment. In practice they rarely are not. Making sure it is, is a very important excercise.
The first step is to make a planogram of your shop.
Here, for example, is a blank planogram of a small shop, I quickly made. You do not of course need a computer; you could just use a blank sheet of paper and a ruler and pen to put one together for this exercise. If you are doing it by hand you will need four marking pens - Red, Yellow, Green and Blue.
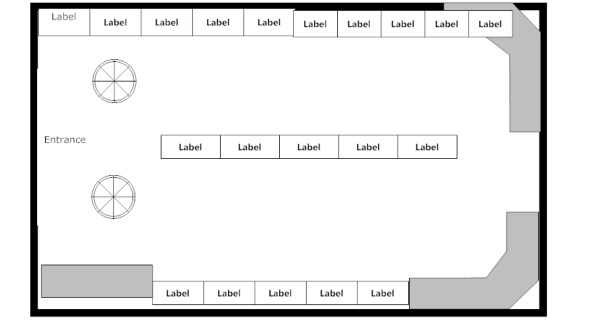
Now the next step is to make two copies of this blank planogram.
Now in your software, please do a top stoock report here for the top 200 selling items in your shop for the past year.
You will find it here marked with a red arrow.
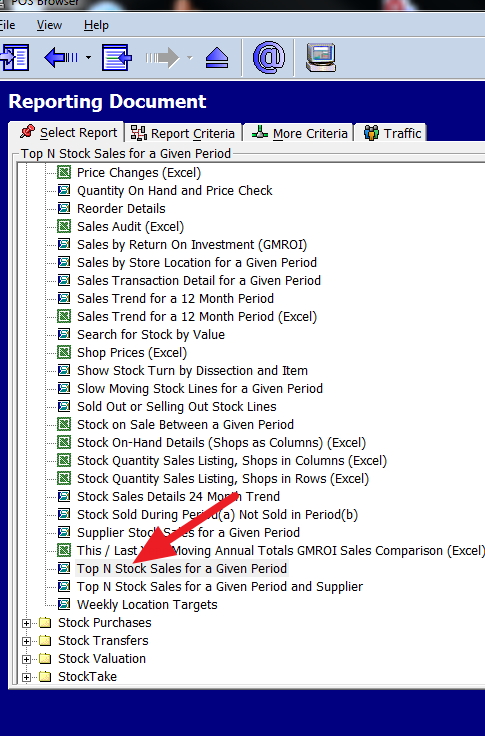
You do not need to print it, only call it up on screen.
Now on the planagram:
- Where the items are on the first page mark their approximate location with the Red marker.
- Items on page 2 should be marked in Yellow.
- Items on page 3, should be marked in Green
- Items on page 4, are marked with a Blue pen.
For the first attempt, I do not recommend if an area has two or more colours to put in all of them, we will discuss this situation in another article.
So you will get something that looks something like this.
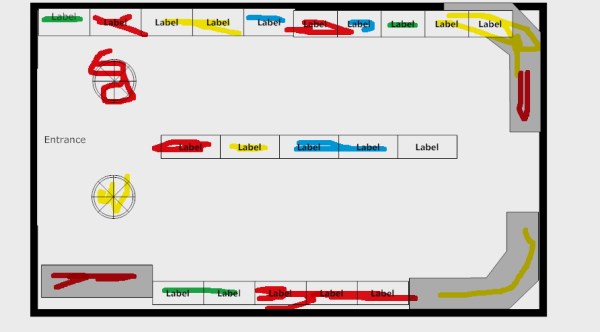
By the way, the situation on the top let with the green is quite normal, people need a few seconds to adjust when they come into a shop, so these spots are often not as good as many imagine.
Now the next step is to take the second blank planagram and mark on it how people go and stay around your shop.
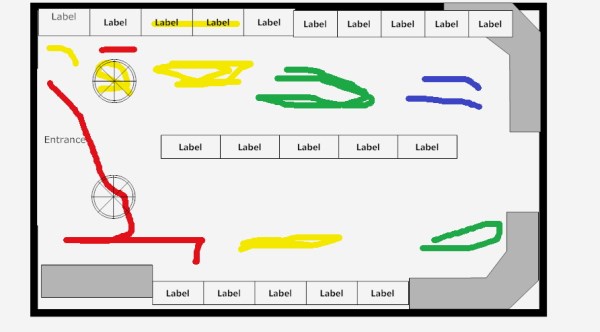
A similar convention is used for this.
- Red is where they go a lot.
- Yellow above average
- Green is average.
- Blue is below average.
- White you just leave, as it is where people rarely go.
Now what you do is compare these two planagrams. Immediately you can see that something is attracting the buyers in the back of the shop. Not a lot of people going there but those that come buy plus it also is producing extra sales nearby. Conversely there is a real problem in items next to the front counter at the front (Bottom left). Plenty of people there but little is being sold. My first reaction would be to stand there and look what does the customer sees. Something is wrong.
This sort of analysis compares the beginning of your sales cycle of where people are to what they end our buying helps you to refine your product offerings.
This is of course a initial analysis, if there is much interest I will show how to add to this anaylsis.

