
I briefly discussed a few days ago some of the features of the preview screen, what I did not show you is some of the power that it has. Many systems in the marketplace are single dimensional, yes they can give you reports but only standard reports. If you want something different, you need to go to your software supplier or start calculating by hand. Since almost always this cannot be done in real time, it gets frustrating that you have spent so much on a computer system, and you are on manual.
Okay let us look at the power of the preview screen in our point of sale.
Let say I want to do some rearranging of the stationery shelf, and I need to know what sells well in my shop with the five pockets next to the coloured markers by Textas. So I go into our point of sale and do a report here.
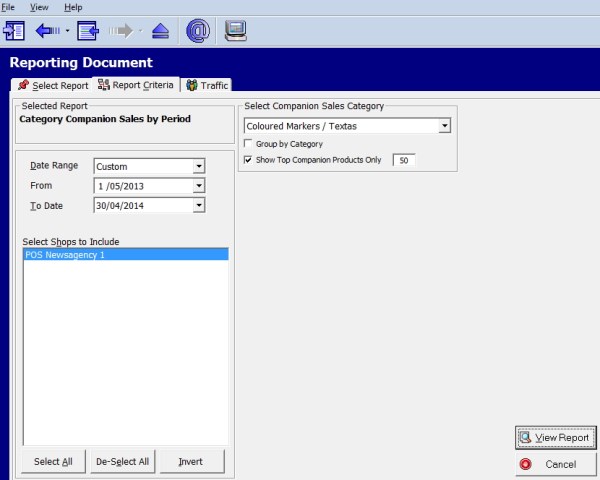
So we can see now we have a list of the items that sell with our Textas coloured markers listed by sales quantity. Fine but what say I wanted to see, which is making the most profit. Now I could go through the profit column looking it up after all potentially I could have pages to look though. This is where people start getting frustrated particularly if they are trying to get the top 5 as here.
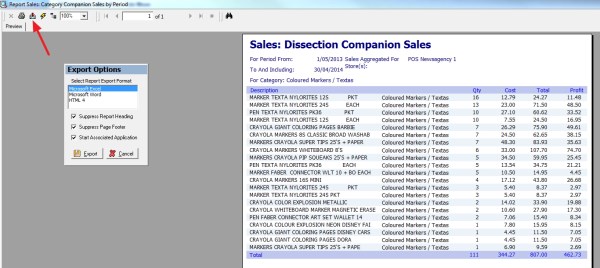
But check out the export option button on the left marked with red. Now if I click that for excel my report is put into excel, and it looks like this, still in the order of quantity but I can ask excel to sort it by profit.
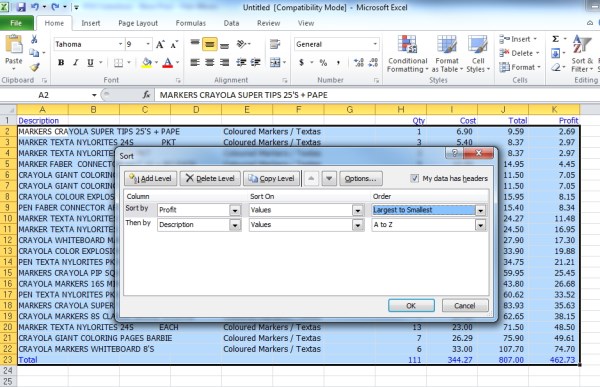
Once I sort this report, I have my answer, it actually took me a matter of seconds to do. As you can see the crayola markers, whiteboard are the most profitable, and it's something I would not have imagined. Not only do I have my top 5; I actually have my leading 23 all sorted in order of profit. I could make it more complex, a common ordering system used in retail is by quantity and profit.

This is just a brief look at the infinite number of reports you can create using our point-of-sale system. I will show you a few more soon.

