
The most important number in retail is the 'Gross Margin Return On Investment - GMROI'
What it does is analyses a business's ability to turn stock into cash.
The formula for calculating GMROI:
GMROI = Annual Sales $ / (Average Inventory at cost) x (Gross Margin %)
Say, for example, an item A sales per annum are $540 with a margin of 30%; you have generally about 40 that cost $2 so your holding cost is $80.
So the GMROI = ($540 = yearly sales)/($80 holding cost) x (30% Gross margin) = 2.0
So this retailer is getting $2.00 in back for every $1.00 invested in this item.
What is commonly done is to use this ratio to compare different items to see where the money for stock can be best spent as it essential that every dollar invested in stock inventory be as productive as possible?
So we may look at a similar item B which has sales per annum are $780 with a margin of 20%, you have generally about 30 that cost $2.1 so your holding cost is $63.
So the GMROI of item B = ($780 = yearly sales)/($63 holding cost) x (20% Gross margin) = 2.5
So this retailer is getting $2.50 in back for every $1.00 invested in this item.
Clearly, the retailer is doing better with item B even though the gross margin is much less.
Now in practice although this is a simple calculation it can be quite a difficult one to calculate as prices, stock holding and margins can change frequently. This is where a computer comes in.
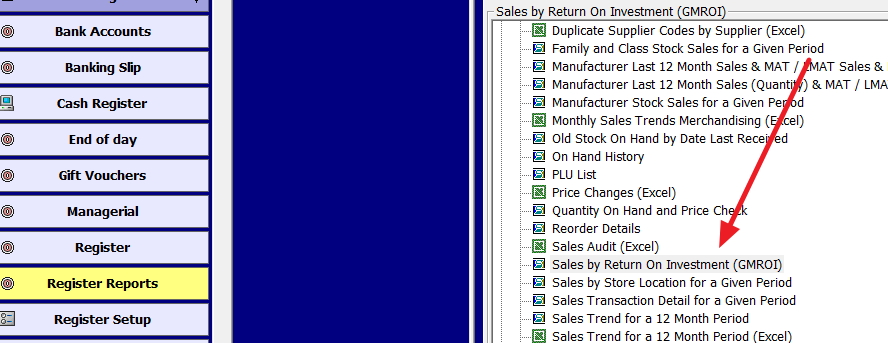
If you go to Register reports, you will see an item "Sales by return on Investment (GMROI)" marked in red here.
Now select an appropriate date range and department to consider.
You will get a report that looks like this. I used a drink department over five years, which is really too long but I want to show a point.
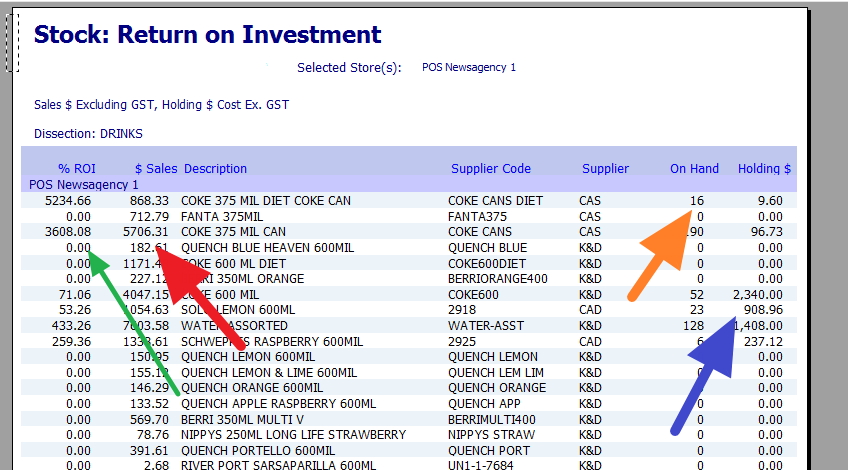
Now in green, you will see the GMROI%.
Then in red the sales in dollars, you need to look at the sales in dollars as a common trap with GMROI is that although the GMROI is high there are no sales.
In Orange, you will see the stock on hand; this is a quick way of verifying that you have enough stock.
How much it costs you now in holding costs is shown in blue.
Altogether, this is an informative report; you will find the summary at the end is loaded with some very useful figures to examine.
So if you’re a number's person like me, this report can be very useful. For example Diet Coke here for example here looks very interesting. High GMROI and low stock holding.
Just another example of how the advantages of our point of sale that can help you make informed decisions to improve your business.

