
A picture it is said, "is worth a thousand words" so in this day of huge amounts of information, pictures make a terrific way of showing things.
With our point of sale software, you can have some amazing data visualization exploration that is I think head and shoulders above what many offer.
It does, however, require some training to use this visualisation but once you master it, you can do some amazing stuff creating your own graphs, charts and even personalised dashboards in a way that is meaningful to you.
I will show you an example here.
This is a graph of card profits per day in a shop over four years
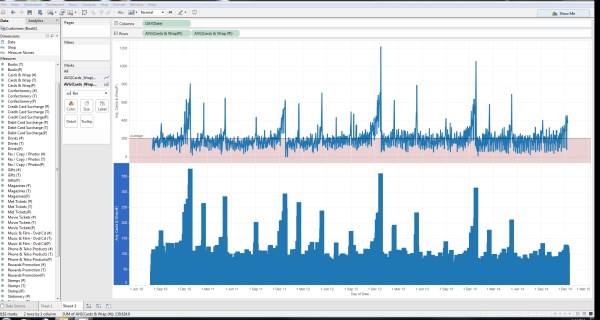
What I have done is on the top showing the profit per day, I made average line and marked in red all days that were below average.
On the bottom, is the number of sales per day.
Now if you look at the graph, you can see that it does have a yearly variation and a lot of other variations, but its not obvious why.
So what I can do is click the date field
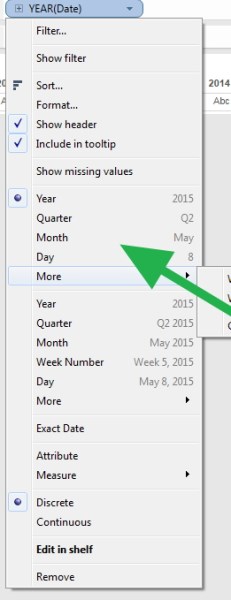
Now I pick year, and I get instantly a graph like this.
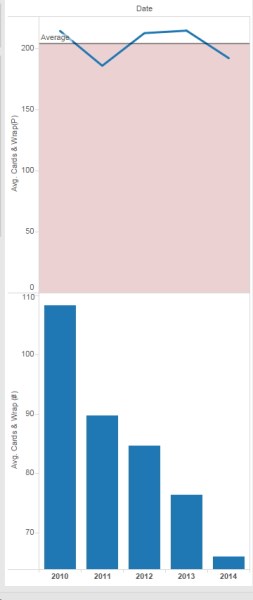
Do not worry too much about 2014 as its only a partial year, but you can see that daily sales on average are dropping dramatically by numbers over the years but that the profit is fairly stable. You can see the shop has gone up market with its cards.
Now I click on quarter and look at sales per quarter, and get this.
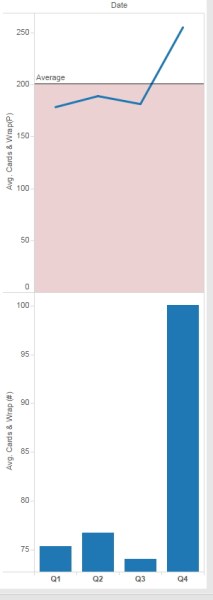
No surprises here as you can see that in the fourth quarter, come Christmas sales of cards go up.
So I decide to click on month,
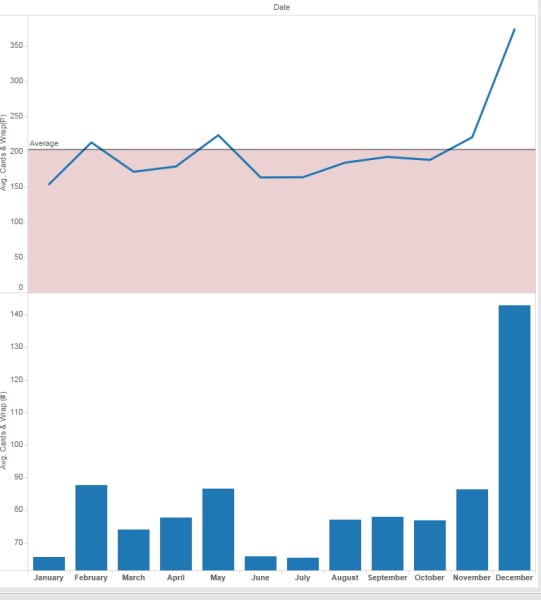
As you can see, December in this shop is a good month for card sales.
So now I click on days of month.
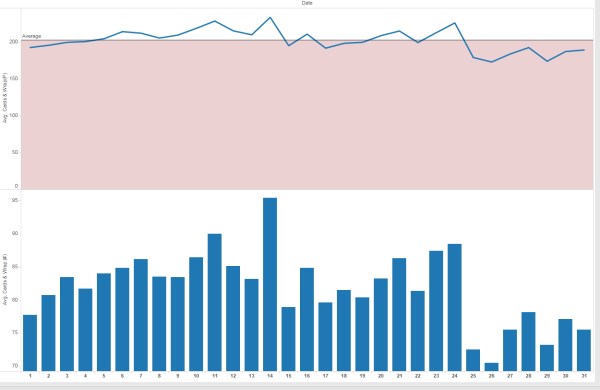
I do not see any meaningful pattern here, although interestingly days of low sale, seem to be days where more profitable cards are sold.
So now I click on weekdays
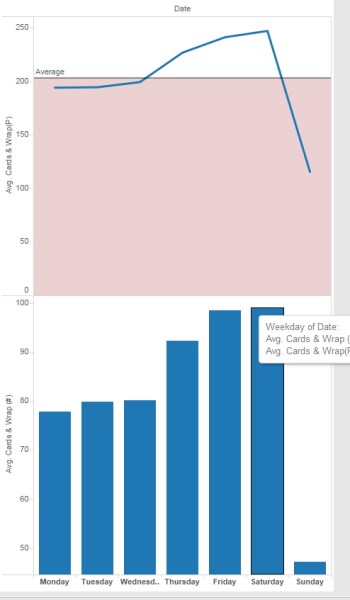
As you can see Friday and Saturday are the best days, and Sunday is generally a bad day for them to sell cards. All things being equal if they were doing any disruptions to the card department, Sunday would be the day to do it.
As this very simple example shows, data visualisation can show us a lot. The shop has gone up market on cards, we have good month sales in December, and poor card sales on Sunday.

