
Recently we were involved in a test made for trials of supply of magazines in retail shops under the ACCC control. So our point of sale software was feeding information to Boston analytics who processed the information for the ACCC and the magazine distributors. At the time and now I still am personally upset as much of the background material was not released so making it impossible to understand exactly what was being measured. Still there conclusion was that the magazines' suppliers could reduce supplies of magazines so saving labour and cashflow but there would be a loss in retail sales.
However, since we were deeply involved we do have access to most of the data of people in the trial, and we decided to wrap it up and see approximately six months later as the dust had settled now what difference these trials made in shop sales.
So we took five years of sales data in a few shops in the trials and analysed them with over three million calculations. We took out seasonality. What we found was very disturbing.
Here is a graph of magazine sales in a retail shop over five years. The figures are in blue but in red what you will see is the long-term trend taking out the days of the week, the season throughout the year, etc.
The trials showed nothing, a big ZERO.
So we do not believe that if the magazines' suppliers did reduce the supplies of magazines so saving labour and cashflow that there would be a loss in retail sales.
Here are some graphs for one shop.
When you look at the average unit sale per day here. The blue are the actual for the days, and the red is the long-term trend taking out the seasons.
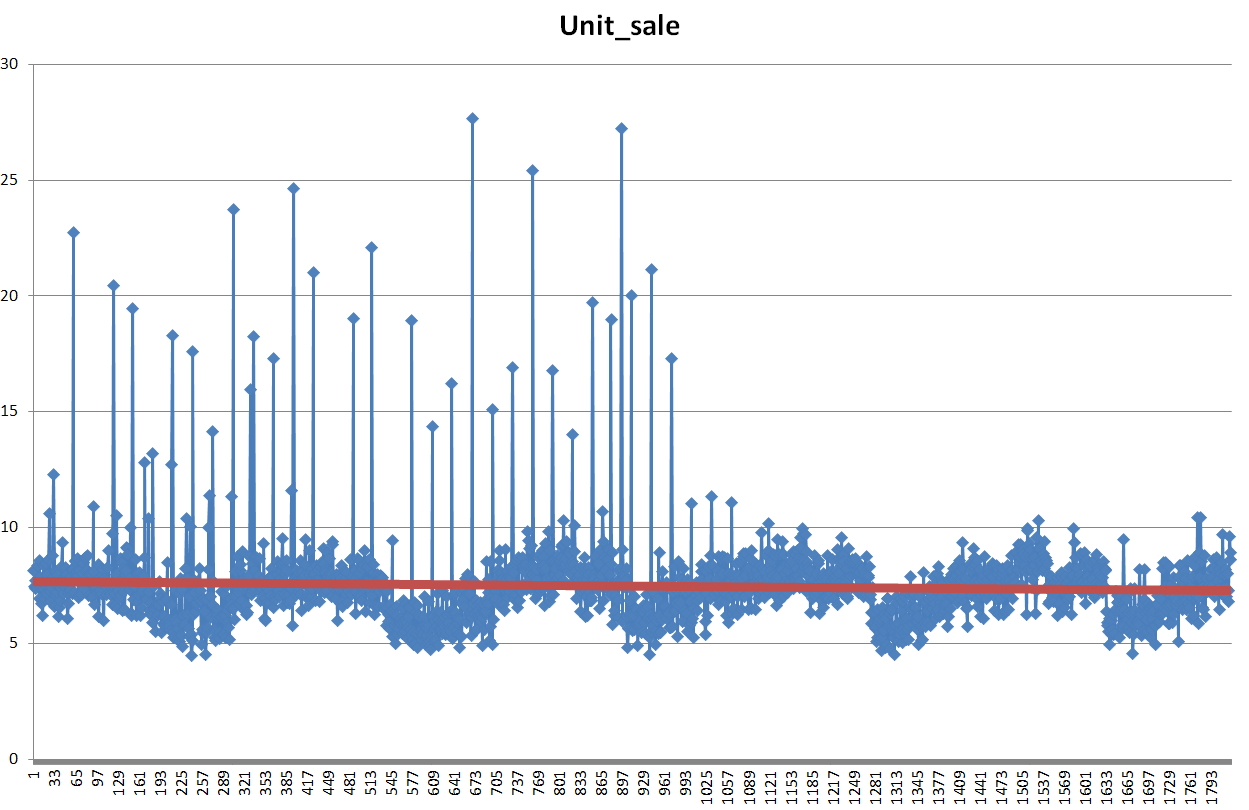
You will see a slight drop but effectively nothing; the average sale in magazines has not changed in five years. Since the margins have not changed either, the long-term effect is zero for profitability, however...
If you look the number of sales, they are dropping so resulting in a fall in profit. Again, the blue are the actual for the days, and the red is the long-term trend taking out the seasons.
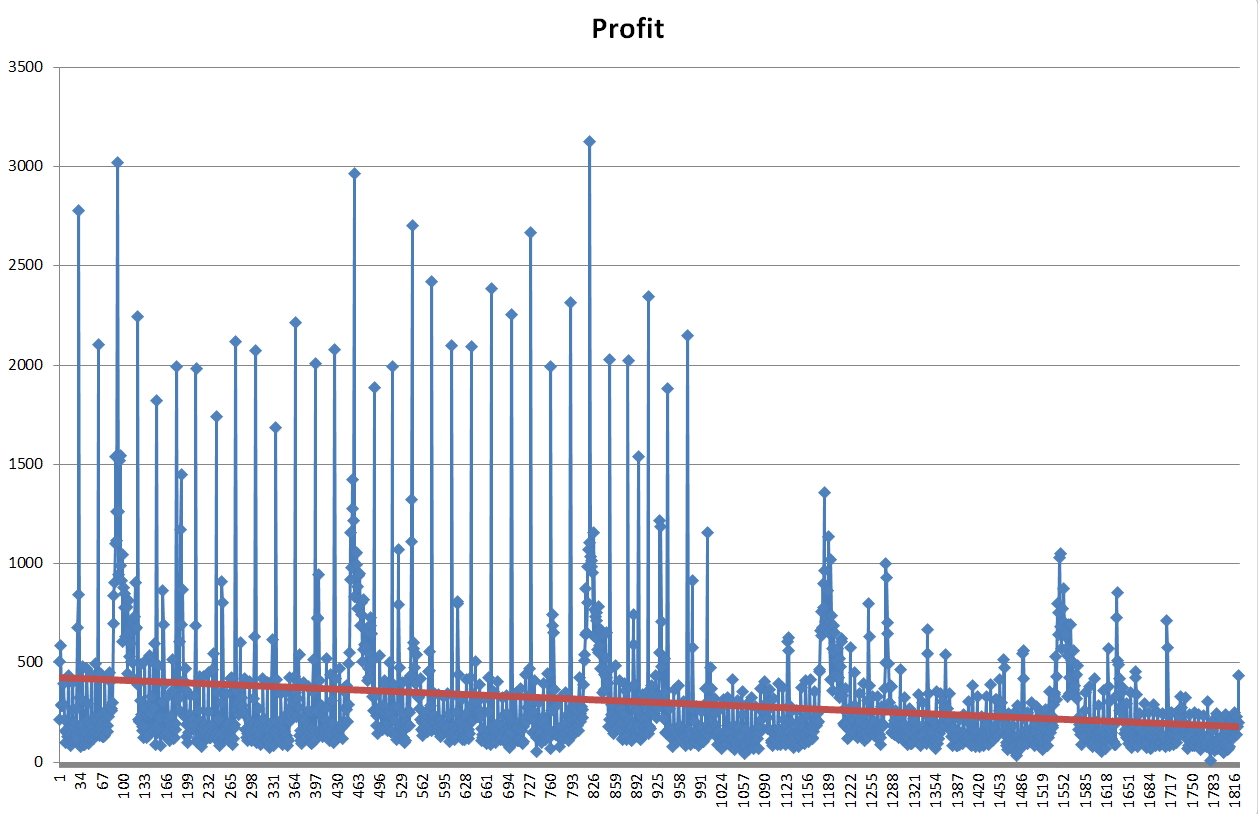
The red line shows it's going down, in less than ten years if nothing changes and the trend continues it will be zero.The actual formula the computer came up with was
Daily Profit = 318.15202249808 + 225*Summer + 224.856057910723*Saturday + 54.5292224195555*Autumn - 0.125207 x (Number of days since 01/10/2011)
The retailer we showed this too, has already reduced his magazine pockets from 900 to six hundred and has asked us to look further.
If you wish us to look at your information, please let us know.

