Often what happens is that stock items that sell well in the shop, but you just do not have stock.
Conversely, what happens is you will have distressed stock, which do not sell unless they are major discounted. So what happens is that they remain on the shelf, taking up valuable resources that could be used towards more profitable merchandise.
This can happen for many reasons, but the result is a serious threat to the livelihood of any business.
Some
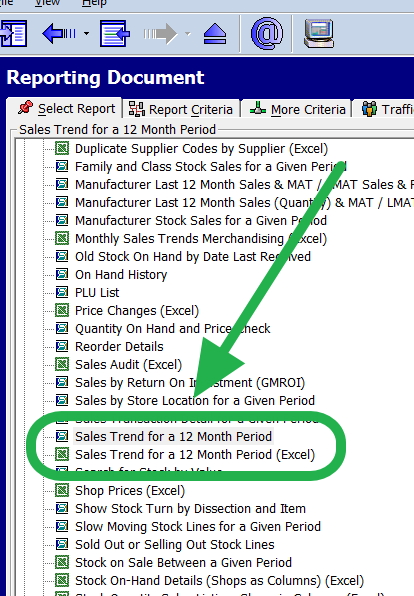
We have two reports that can help you check your stock levels manually circled in green.
The second I put in here only for completeness but I will discuss it in a later post as filtering, macros, note taking and presonalisation of reports which are all too big a topic for this post.
In this example we select.
Cash register > reports > stock
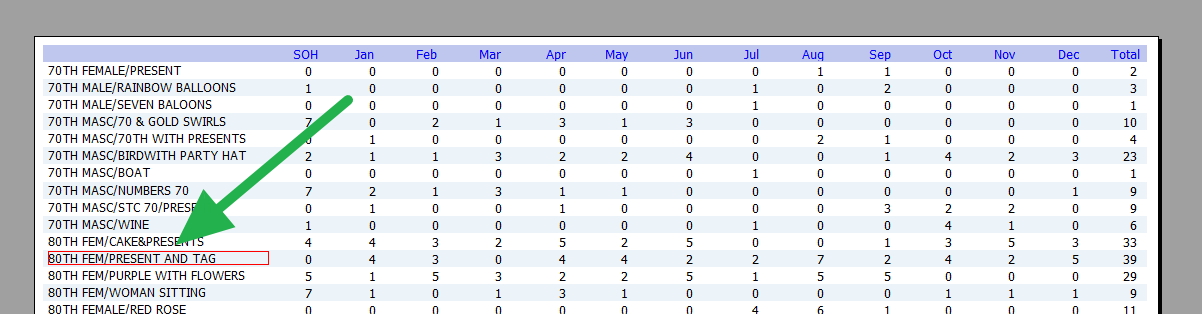
Then Sales Trend for a 12 Month Period.
 iness is