
The key indicator in retail today is the Gross Margin Return on Inventory Investment (GMOII), and it is considered the best way of measuring how profitable is your stock. Commonly it is done by a department and stock item although it can be used in a wide range of categories eg area. What it measures is for every dollar you invest, how much do you get back? In practice, your GMOII depends on two main factors your stock turns and your profit margin.
This may be a bit difficult to follow but I think you will find it worth the effort as it is the most important KPI in retail.
Here is an example of how it works in practice, say I buy one item at $120 and sell it for $160 once a month
So you purchased $120 of stock sold it for $160, your profit would be $160-$120=$40, as your cost is $120 and profit/cost is your GMOII. So your GMOII it would be $40/$120 x 100%= 33%.
Now we do two turns, so it is two months
You make a purchase of a stock item for $120, you then sell it for $160, then you restock another $120 and sell it for $160. So $100 cost has resulted in $320 sales, as from the first $160 of sales you purchased $100 of stock, your profit is $160-$100+$160 = $220, so the GMOII is now $220/$100 x 120%= 183% even better.
However what happens if I do three turns, so it is now three months
You make a purchase of a stock item for $120, you then sell it for $160, then you restock another $120 and sell it for $160, now you purchase another $120 worth of stock and sell it for $160. So $120 has resulted in 3 lots of $160 sales minus 2 lots of $120 cost, so your GMOI is now (3 X $160 - 2 x $120)/$120 x 100%= 10000% which is pretty awesome. This is why some products like newspapers can show such incredible profitability even though they are not very profitable, its because they have high turns. It also shows the limitations of this KPI as it's rare for people to make much out of newspapers today.
Now, this sort of calculation is impossible to do by hand, but with a point of sale software, it is easy. This is how you do it with us
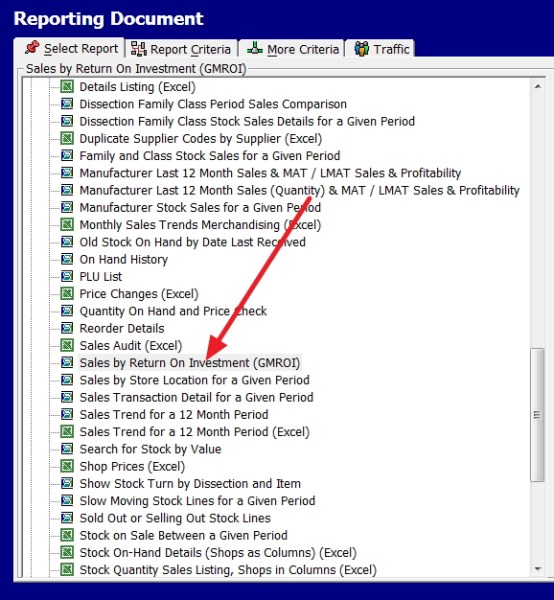
Go to reports and select "Sales by Return On Investment (GMROI) see the red arrow.
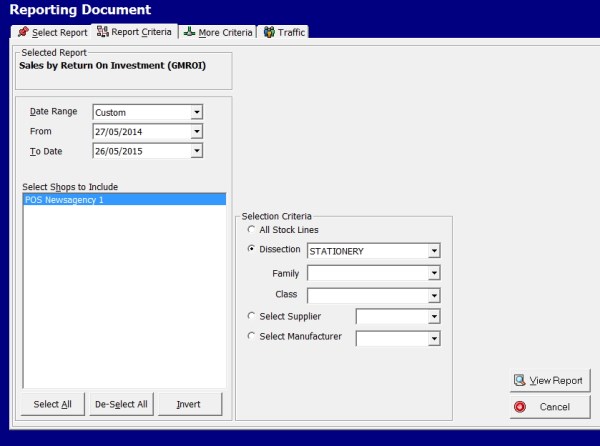
Now put in the required options, here I picked stationery department. I do suggest that you do this by department although here we will be doing stock items because it will give you a comparison. The other problem is that GMROII tends to vary significantly between departments and area in a shop.An item on the front counter needs to have a much higher GMROII then the same item at the back of the shop.So an item its best measured by its peers.
When my report comes up here, I further suggest that you export it to excel using our AD HOC reports although many of you will find the report here fine.
Note If you do not have excel, use openoffice which is free which our software can integrate into too.
Once in excel, I get this.
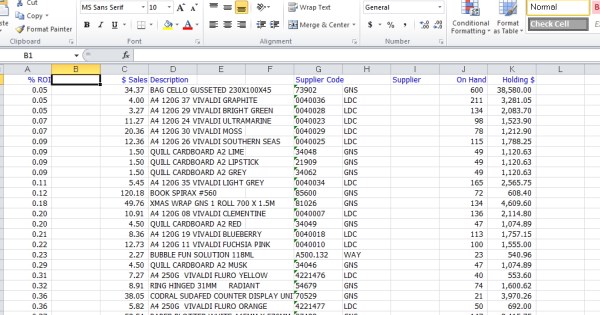
As a rule the higher the GMROII is, the better but what it can also show these high figures is that you are not stocking enough of these products. Say ten people want a stock item, you stock eight so you have sold out, but you could have got another two sales which you have lost. However if a GMROII is low it almost certainly means a problem.

