
This is something that I am sure you will find very useful. Sometimes what you want to do is run a report with slightly different options to see what happened. Say I decided to examine my basket sizes by department this year compared to last year. What I can do is run the report as here.
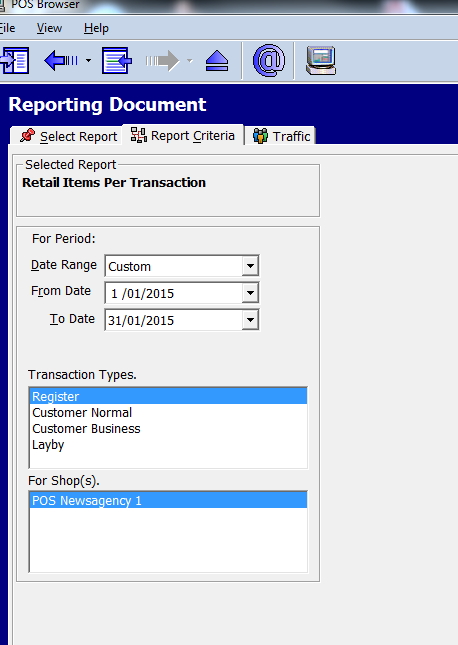
So in this case I want to check the basket sizes in January of this year. Now when the preview of results comes up, what I do is adjust it on screen using the mouse so it is out of the way. Next I go back into this report above which has all the setting still highlighted and change the year 2015 to 2014. Then I let it calculate the report again giving me a new preview screen.
I then adjust the two previews, so they sit side by side so they look like this. Click on the screen for more detail.
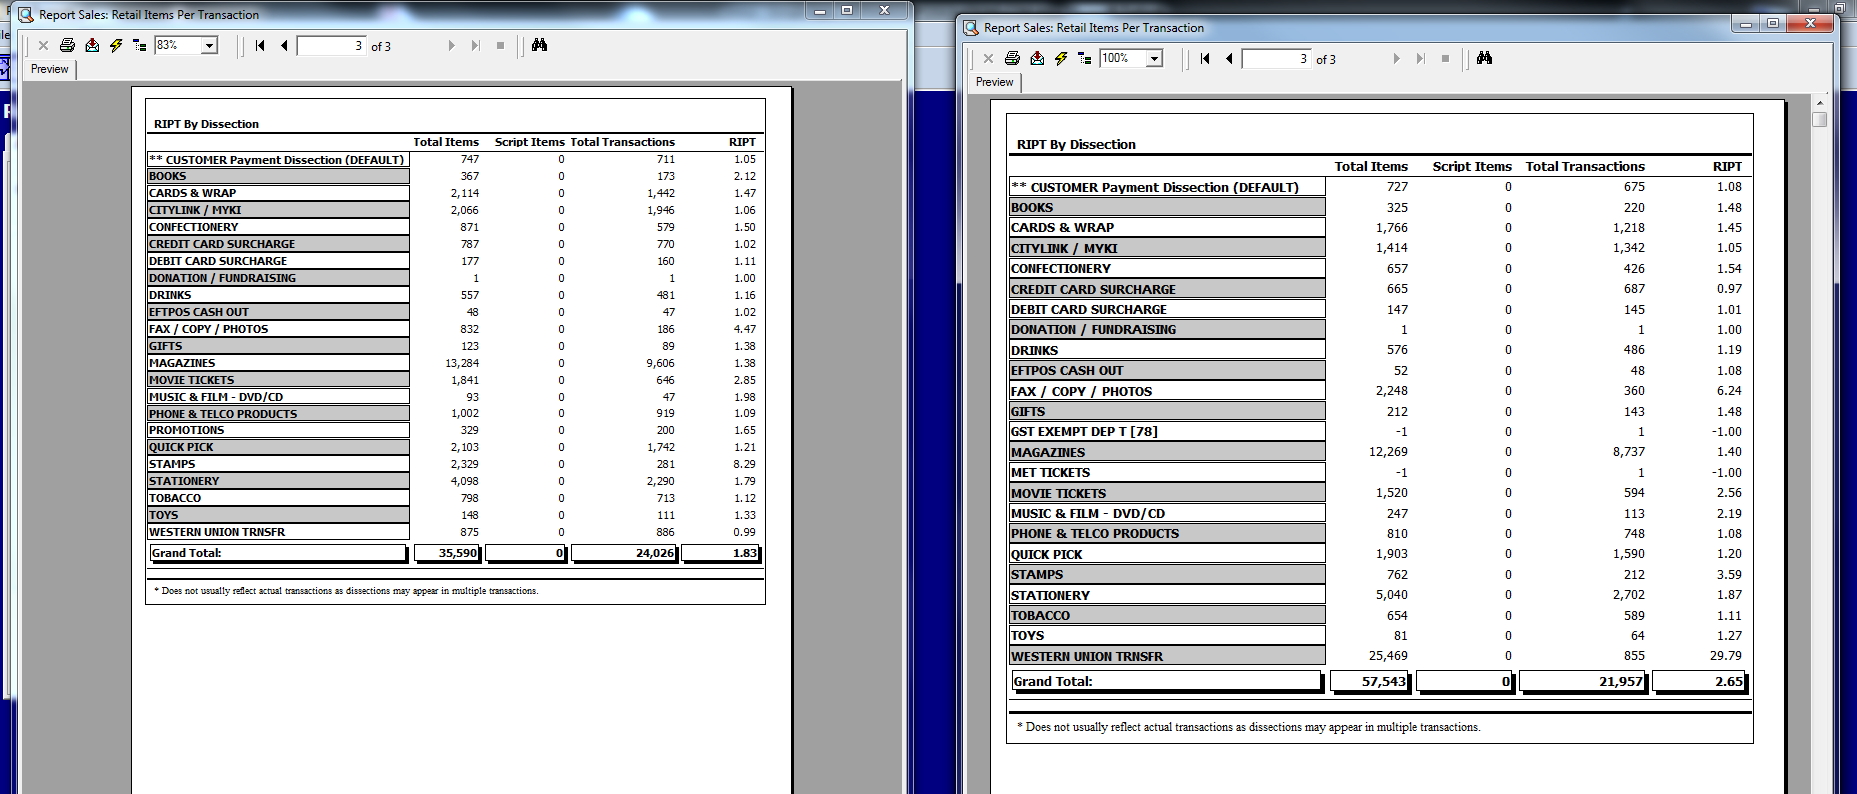
I can then examine the changes over time. Of course I could compare for time, department, stock item, etc etc etc
Pretty swish!

