
Economic order quantity (EOQ) is something that I have not come across this in a long time and in the past few days, two different people have asked me about it. I think because it is being oversold as a tool by someone who should know better.
What it is, is a scientific method of determining how regularly you should order your stock to minimize your costs. It is widely used as a guide rather than a rule, but as you will see its rarely of much use in retail. A fair good description of it is available here in the Wikipedia.
What I will be doing is showing you here a step by step guide how to determine this value. My intent here is to explain the main principles of the system. If there is enough interest, we may look into dynamically automating the process to handle the large and frequently turning inventory our clients have to help them make better purchasing decisions.
To calculate a simple EOQ requires three variables which I will discuss point by point quoting two departments as an example for you to work with as an example stationery.
The demand quantity (D)
This is the quantity of the department moved.
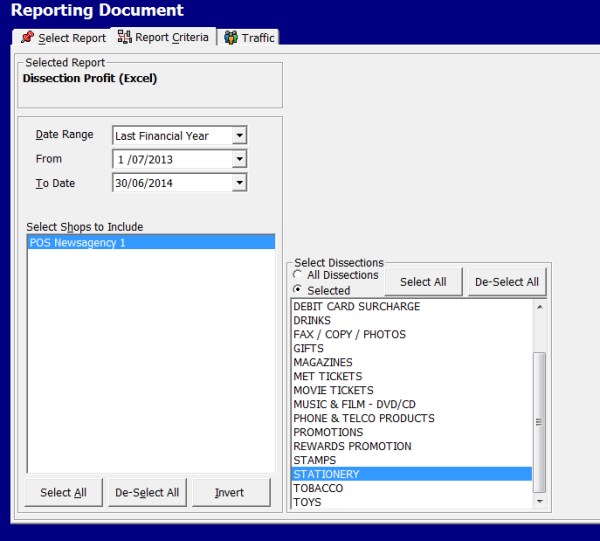
To calculate this figure, I went through the Dissection profit report in cash register reports.
Now I select the options I required. I suggest a long period to smooth out the irregularities over the year so in this example I picked last financial year see here. The other reason is as you will see that we require financial figures for the period.
This produces for me an excel spreadsheet.
I go to the end of the column marked STATIONERY (#) and used the excel sum function to get me a total of 60575 items in the year.
Cost of ordering (K)
This is the cost of doing an order. So let us say in this shop it takes one person three hours to go over the stationery to make an order at say $25/hour plus it takes one person four hours to go to pick up the order say again at $25/hour plus $10 petrol plus often another $20 for a delivery fee for the stuff that has to be delivered. This cost K would be = 3 x 25 (ordering) + 4 x 25 (pickup) + 10 (petrol) + 20 (delivery) = $205.00.
Holding costs (h)
This is the cost of holding the items in stock per unit, say, for example, 2.5% bank fees and overdraft, 1.5% missing (theft), say I feel that stationery in my shop is about 10% of the rent, so I say $15,000 a year and doing a similar calculation I might be looking at my profit and loss for the previous financial year might be $10,000.
So I need my average stock holding to calculate my holding costs. So I went to the stock turn report in the stock reports and used the following options for the last financial year
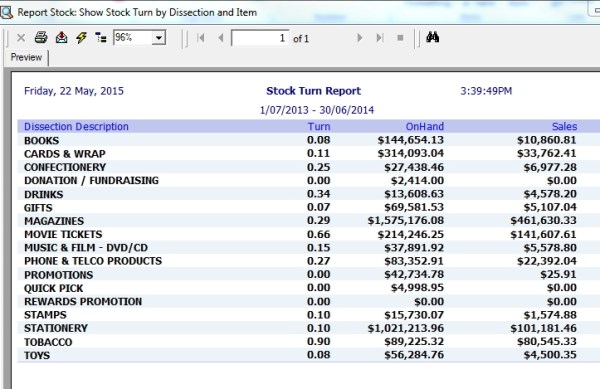
Now the holding costs in my example would be
(2.5% bank fees + 1.5% missing) x $101,181.46 + $15,000 rent + $10000 = $65,848.56
divided by the 60575 items in the year which works out to $1.08 per item per annum. This figure, by the way, tends to shock people. Few people appreciate just how much in retail it costs to display an item. Possibly it is worth many people's time to do this exercise just to get this figure.
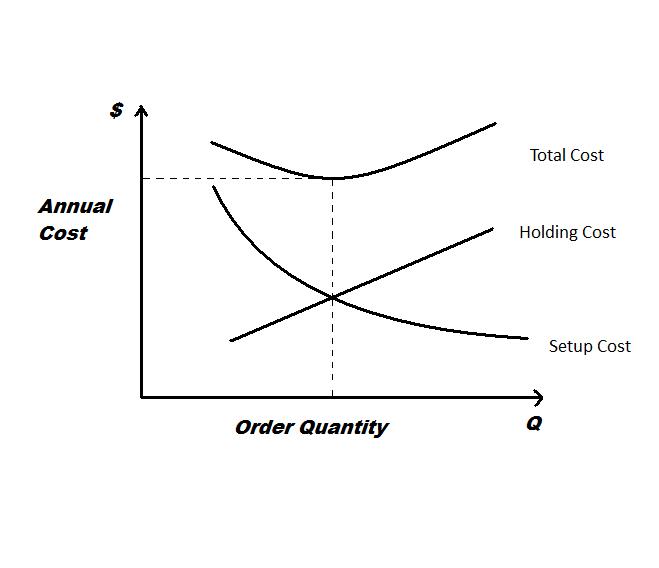
Now the number of times I should order economically is sqrt(2 x D x K/h) which you can easily put into excel and out pops a number of 4779 times a year to order, in other words, its best to order every day. Something that is totally unrealistic.
It does, however, prove the old adage that in retail its best to order small but frequently.

