
Reader here, might be interested in knowing that Friday post on data visualisation created much discusion.
Several questions were raised. One was very interesting was that much of the data that you want to investigate with your shops data is not available in your shop's information, for example, the weather, retail statistics, unemployment, inflation, etc.
So the asked can you get something like this say the weather into the data visualisation?
The answer is yes. If it can go into SQL or excel not a problem.
So how was the next question.
The first point is you go to the Meteorology Bureau website, then you go
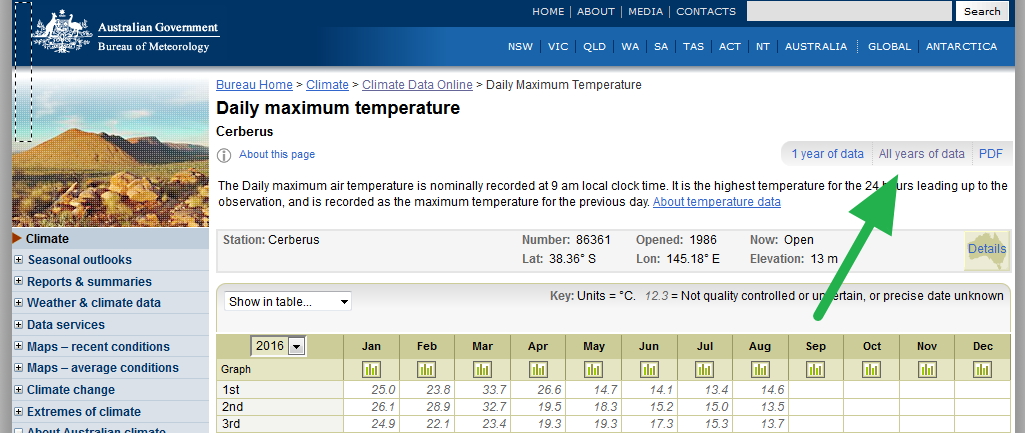
Bureau home > Climate > Climate Data Online > Daily Maximum Temperature
And click where I have highlighed with a green arrow to download an excel file of date and maximum temperature.
and do the same for rainfall.
Bureau home > Climate > Climate Data Online > Rainfall.
Now you can put these into an excel spreadsheet and then import it into your table.
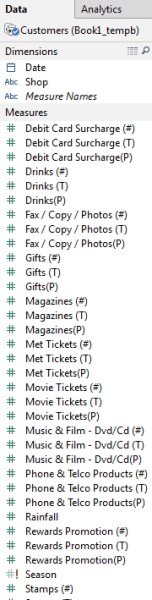
As you can see Rainfall been added.
Now let us compare sales of greeting cards by rainfall. This produces the following graph.
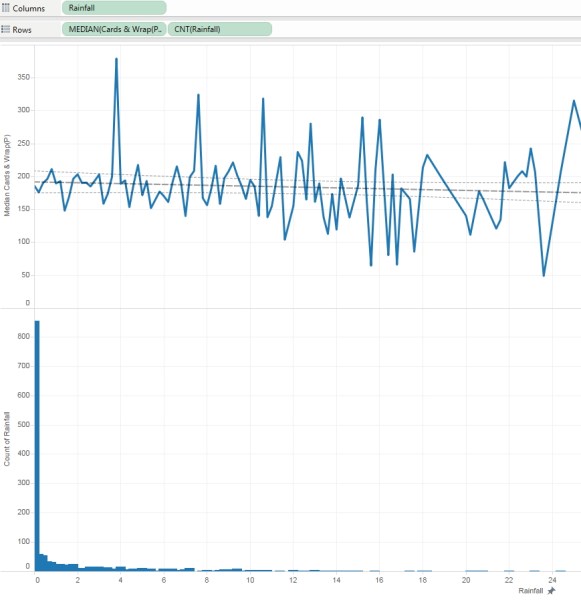
On the top is the average profit of cards per day and on the bottom is the how many points for each measurement. I then added a trend line, and as you can see there is not much there of a trend. Card sales are clearly not much affected by rain here.
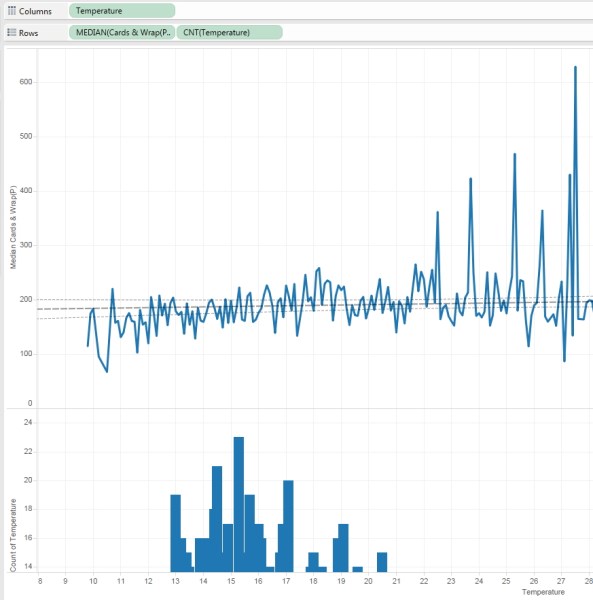
I then decided to do it by the temperature. Again if you look at the trend, there is not much although a nice hot day is making some improvement.
This makes me conclude that the weather does not make that much difference in this store to card sales.
However, I decided to measure the drink department. Now you will see that the weather here made a big difference.
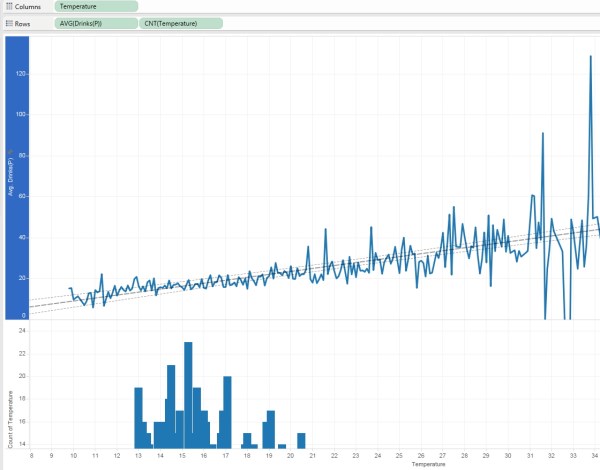
The trend is clearly up, hotter weather is generating more sales here.
This simple example shows the power of our data visualisation.

