
Introduction
Running ͏a shop requires you to keep track of how your business is doing. This can be challen͏ging if you sell products from different suppliers. Base͏d on my own experience, I have found that monitoring suppliers’ performance is ͏very useful.͏ You want ͏to know ͏which ones bring you more sales and profits and which are lagging behind.
One way to do this is to use the “Sales Comparison by Supplier” report in your POS System. This report will show you͏ the actual figures and the͏ changes over time for each supplier. By ͏analysing your suppliers, I ͏have gained valuable insights about my shop based ͏on various criteria such as the number of sales, total value of sales, avera͏ge sale amounts and ͏profit. For example, I have ͏determined which suppliers are unde͏rperforming or overper͏forming. I have also used ͏this re͏port to assess if my suppliers are giving me enough margins to meet my needs.͏
In this article, I will share with you how to use th͏e ͏“Sales Comparison by Supplier” report by walking you through the steps, interpreting it, and th͏en taking action based on͏ it.
How to Access the "Sales Comparison by Supplier" Report
To access the "Sales Comparison by Supplier" report, follow these steps:
It is in the register sales reports; find the report "Sales Comparison by supplier."
Click on it, and you will get this screen.
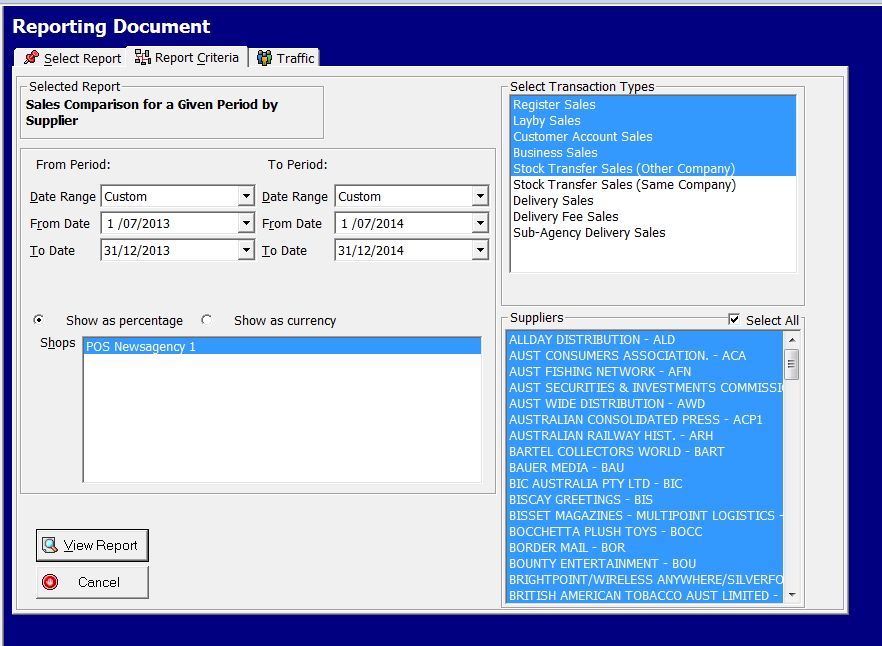
How to Customise the "Sales Comparison by Supplier" Report
To customise the "Sales Comparison by Supplier" report, follow these steps:
Select a period for the report, let us keep it simple so start with the past 12 months and compare it with the previous 12 months. So leave it AS IS, and run the report. Afterwards, feel free to explore more options as desired.
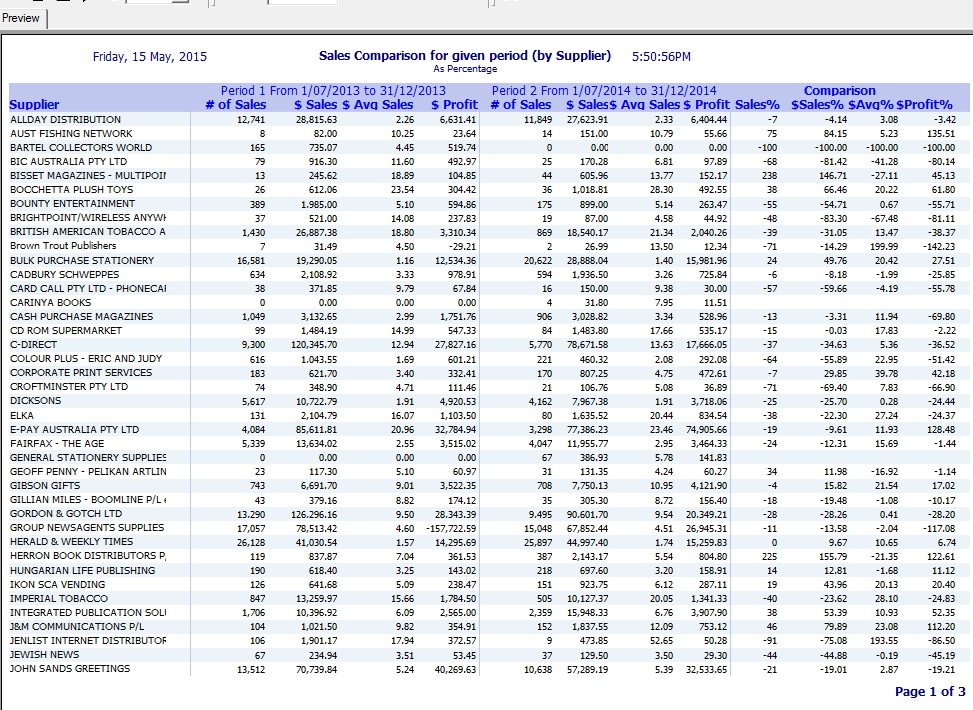
Screenshot of Customised Sales Comparison by Supplier Report
How to Interpret the "Sales Comparison by Supplier" Report
You have a report of your suppliers that shows you the summary statistics for each supplier. They are based on each criterion you selected and a comparison of how you have been travelling with them. The big ones and those with significant movements in the comparison percentages are fascinating.
Look at the profit figure. Today we are seeing significant downward margin creep. This is an excellent place to see it. The reasons for this downward margin causes appear to be many, and it seems to be both due to changes in customers and suppliers. I will discuss this in another article.
Now rerun this report and compare suppliers based on those that handle similar products. Now compare and contrast these different suppliers based on their performance over time, noting the number of sales and profit.
Conclusion
Now Take Action Based on the "Sales Comparison by Supplier" Report. I would contact underperforming suppliers and communicate to them your concerns. Then I would ask those suppliers that I am doing well with how you can do more with them.
The report is an actionable tip.
Please give it a go and see how it goes.

