Point of Sale Software

Here are some Articles from the Blog Subject - stock sales -

Scan rate in retail

POS SOFTWARE

Setting up a scanner


Your point-of-sale (POS) system can give you crucial information that can help you drive your retail productivity, accuracy and profits. To do that it needs accurate information. Are you getting good information? One key retail metric (KPI) often overlooked to reveal how efficiently your POS system operates is the scan rate percentage %Scan.

Luckily, your POS Software can give you this and show you how to improve this.

Why the Scan Rate Matters

The POS scan rate (%Scan) shows the percentage of products scanned compared to the manually keyed-in at the cash register. A high scan rate translates directly into faster transactions, shorter checkout lines, and happier customers. It also results in fewer errors and less waste that hurt profits. Manually entering product codes is slower, more demanding on staff over a shift, and inevitably leads to mistakes. The industry standard is that cashiers make around one error for every 300 characters typed daily.

In contrast, scanning barcodes with a POS scanner takes just a fraction of a second and is a million times more accurate! The higher your scan rate, the more transactions you can process, lower errors, and provide better customer service. Better product information captured during scans also gives you valuable data for purchasing, promos, inventory and more.

Checking Your Scan Rate

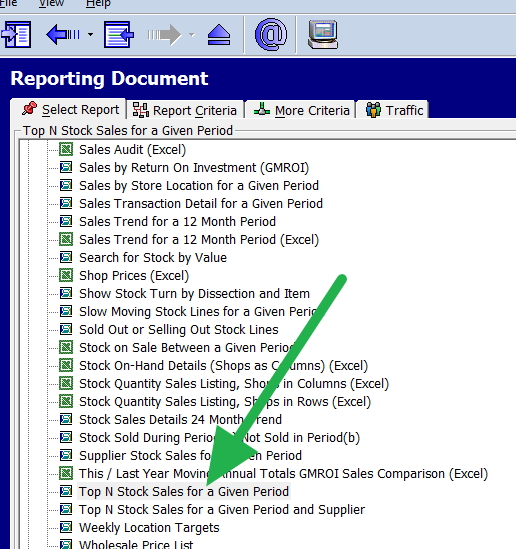
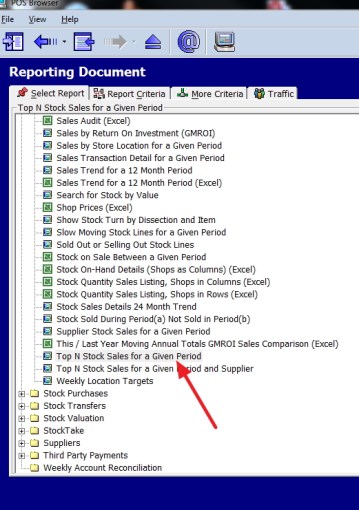
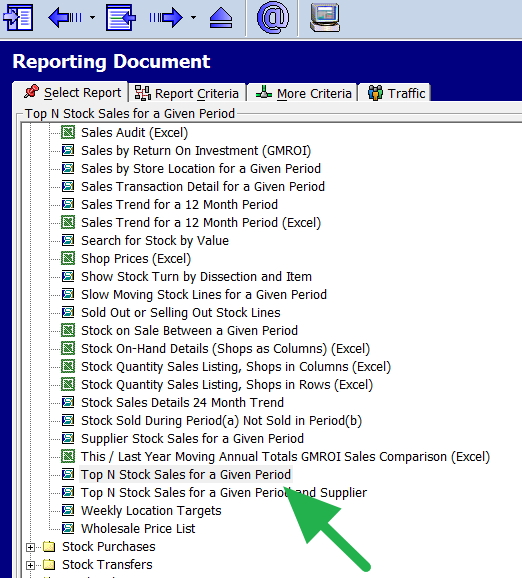
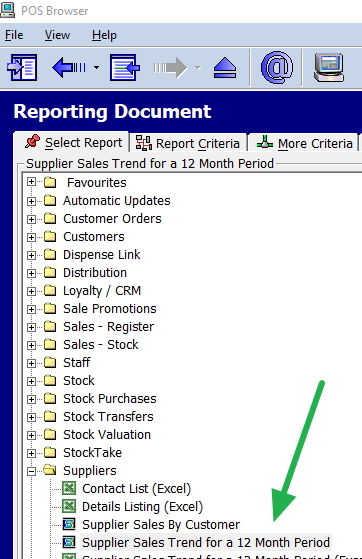
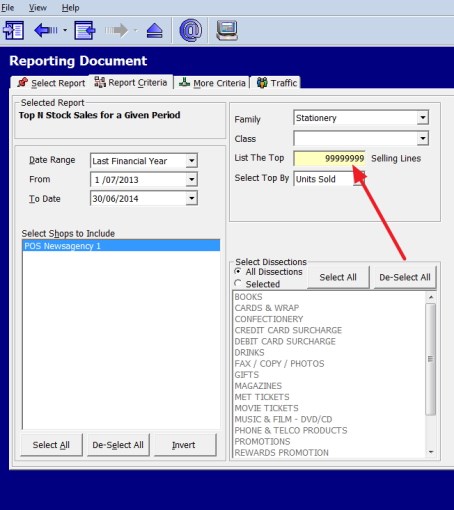
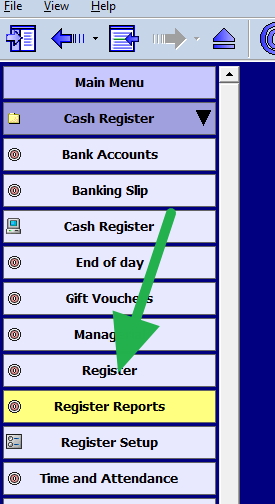
Finding your current scan rate percentage is easy using your POS reporting. Go to the cash register reports, open the Sales section, and select "Dissection Sales/Profitability for a Given Period".

Go to the cash register reports.

Then go to sales.

Scan rate report


Once there select

Dissection Sales / Profitability for a Given Period.

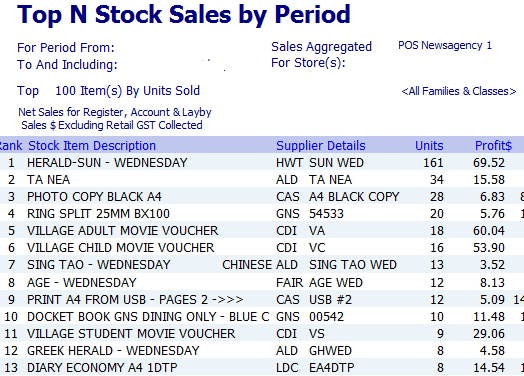
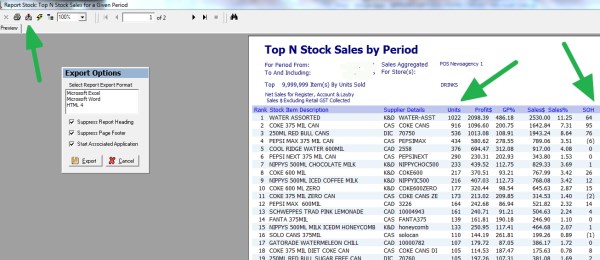
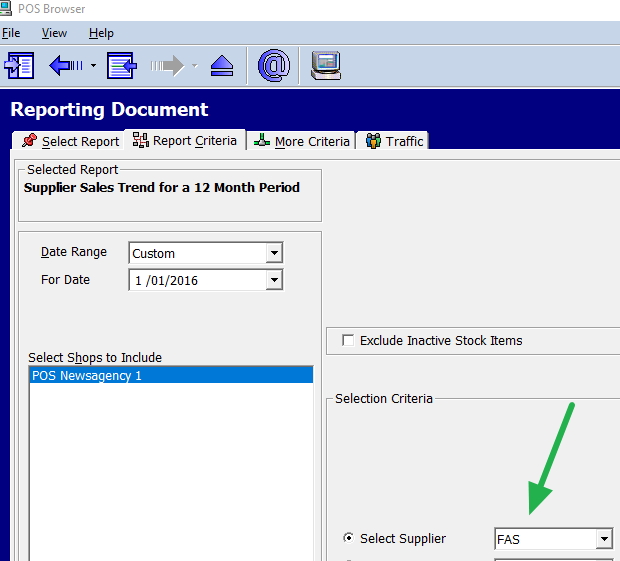
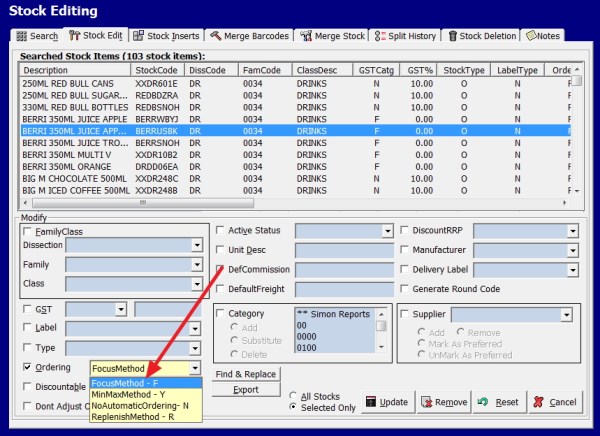
Now run the report with a year of data.

Scan rate %

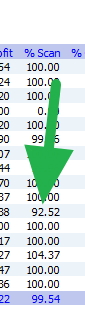
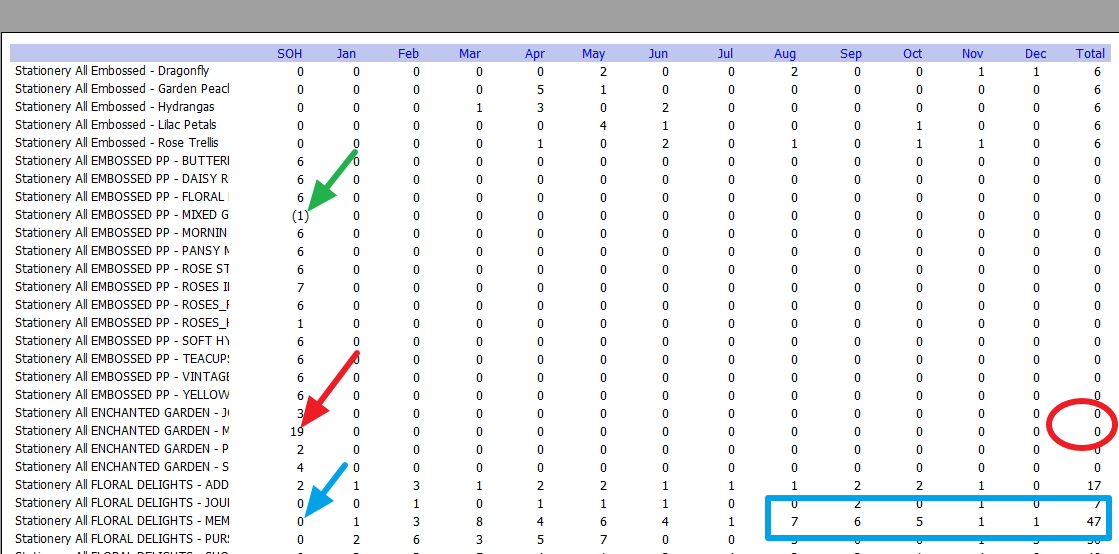
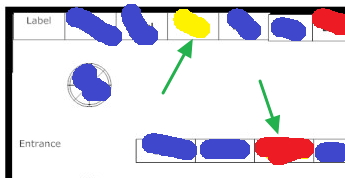
You will see a column with %Scan; the higher, the better. Looking through this list, the problem department is marked with a green arrow.

Run it for at least the past 12 months to see trends. The %Scan column reveals your overall rate across products and departments. Ideally, you want to see your scan rate consistently above 90% for maximum efficiency. Look for low percentages that stand out. While the overall rate matters, drill down into individual departments and product categories in the report. This allows you to pinpoint sections of your inventory that need scan rate improvements.

How to Boost a Low Scan Rate

If your scan rate is low, identify underperforming departments or products lagging in scanning. Then, focus on addressing the root causes:

  • Missing barcodes - Confirm all inventory has scannable barcodes printed and attached. For any products without barcodes, quickly print and add barcode labels.
  • Faulty scanners - Your barcode scanners may be aging or defective. The industry standard is that a scanner is built to last about three years, and then you have a bonus.
  • Staff training - Cashiers may need refreshers on scanning techniques and procedures. Observe them on the POS and provide feedback to build good habits.
  • Product database - Check your POS system to ensure the product database matches all items to the correct barcodes. Add any new products that are missing.
  • Check items - Sometimes the barcodes are not clear, if so notify the supplier and consider using inhouse barcodes until this can be fixed.

Scanning Drives Retail Success

Improving your POS scan rates pays for your bottom line. It reduces wasted time and costly errors while increasing transaction speed and customer satisfaction. Make it a priority to monitor scan rates, identify underperforming areas, and address gaps. Turn your POS system into a competitive advantage!

Add new comment

Restricted HTML

  • Allowed HTML tags: <a href hreflang> <em> <strong> <cite> <blockquote cite> <code> <ul type> <ol start type> <li> <dl> <dt> <dd> <h2 id> <h3 id> <h4 id> <h5 id> <h6 id>
  • Lines and paragraphs break automatically.
  • Web page addresses and email addresses turn into links automatically.
CAPTCHA This question is for testing whether or not you are a human visitor and to prevent automated spam submissions. Image CAPTCHA
Enter the characters shown in the image.

Too much negativity with Agency business

POS SOFTWARE

Agency business is when you handle a product as an agent. There are many such products, for example, lotto, post office, newspapers, etc.

A typical SMB retailer would have been an agent for many different products in the past.

Today, critics would complain that this agency's work has low margins, which is often true. Plus, if the agency has a winning product, they will often tend to lower commissions and increase handling costs.

But, I would argue that the key to a modern retail store is to get the people in the door. One point is that a good agency often can bring in people. This is no small matter. Today, a typical major is happy to pay $30 in advertising costs to attract a prospective customer. If it works and they get them in your shop, how much is that worth to you to get a potential paying customer in your shop. How much in advertising do you or people in businesses like yours pay to get them in the door? As an agent, you pay nothing, and if they buy, you will make a slight profit, plus have a chance at extra sales.

Of course, the big question here is will they buy more? Yes, some products, like mobile rechargers, generally do tend to bring in good customers. Many, however, do not.

I recommend if you handle these products by checking your companion reports in your POS software.

This will tell you what sells with a product.

Go to Register reports.

Go to reports > Sales register > Stock Sales companion sales by period 

In options, put in, say, last financial year and put in the product. 

Now out pops up a report which will give you a listing of all the items that were sold with this item. It is worth examining this list. By rearranging your stock arrangements, you may get more sales. 

Then at the end, there will be a total profit. Now the question is, how much of that profit would you have made anyway, with or without that profit. That is something you have to decide. 

An analyst like me, as a first-level approximation in the absence of any other information, would probably say

  1. Some would have brought the extras anyway.
  2. Some would never have come. This is partly due to the large advertising campaigns many agencies pay.

So I would say 50% of this profit would be lost plus the profit on the agency work.

If you can do a better estimate, let me know. Big Data can help but you will need to ask us to help you there as few can do it in-house.

You now have a start on how useful that agency is to your business.

Add new comment

Restricted HTML

  • Allowed HTML tags: <a href hreflang> <em> <strong> <cite> <blockquote cite> <code> <ul type> <ol start type> <li> <dl> <dt> <dd> <h2 id> <h3 id> <h4 id> <h5 id> <h6 id>
  • Lines and paragraphs break automatically.
  • Web page addresses and email addresses turn into links automatically.
CAPTCHA This question is for testing whether or not you are a human visitor and to prevent automated spam submissions. Image CAPTCHA
Enter the characters shown in the image.

Planograms 101, a picture is worth a 1000 words

POS SOFTWARE

A plan for displaying merchandise used to maximise profits is called a planogram. 

Now because retailers are starting to see shoppers back, many of our clients are checking their stock layouts. So many of our clients are ringing up our support about doing planograms so clearly my post on Monday about the division of stock into sales categories was interesting to our readers here.. A step by step approach to this is available here.

Before starting, look at the above diagram to see the concepts and what you will get out of these planograms. 

The goal is to use your space to the maximum. So what we are going to do is visually see a plan of what is happening in your shop. 

A sales report was used. We then divided the departments then divided the sales data by the linear measurement of each area and divided the result into the following groups.
 
Blue = Good (Top 20%)
Yellow = Average (Middle about 60%)
Red = Bad (Bottom 20%)
blank = Zero

This information was then marked on an actual shop entrance plan shown here. Now you can see how it visually shows the shop's sales information. See the two spots marked with the green arrows, particularly the red one. That is something to look at that spot; it is not pulling its weight.

It is often also interesting if you have spots in what should be in a dead area that is doing better than everything around them. Products that do well no matter where they are on the shelves are great for drawing people into the shop.

What is essential is to make two diagrams, one using profit and the second by numbers. Good products both brings people in and makes profit.

Whatever changes you make, keep the planogram and redo it in a few months to see what the changes did in your shop. Then compare the two planograms. 

Now click here to start on your planograms.

Note this is only the start we recommend these planograms for shoplifting and product placements but that is a subject for another day.

Add new comment

Restricted HTML

  • Allowed HTML tags: <a href hreflang> <em> <strong> <cite> <blockquote cite> <code> <ul type> <ol start type> <li> <dl> <dt> <dd> <h2 id> <h3 id> <h4 id> <h5 id> <h6 id>
  • Lines and paragraphs break automatically.
  • Web page addresses and email addresses turn into links automatically.
CAPTCHA This question is for testing whether or not you are a human visitor and to prevent automated spam submissions. Image CAPTCHA
Enter the characters shown in the image.

Use your data to make your decisions.

POS SOFTWARE


If you look at the big retailers now, you can see that they are taking advantage of their vast amounts of data to build muscle to run their business. Here is an interesting piece of statistic. 35% of Amazon purchases and 75% of Netflix viewing now are based on computer-generated recommendations.

Ask yourself if they use it, why are you not using it? You have AI, too, in your POS Software. In our market space, it's the best and it is *FREE*.

So why are you not using your data to make decisions?

To be successful today, retailers must stay in tune with their stores' unique preferences and behaviour. Yet, there are too many stock lines and marketing seasons to do it properly manually. The best way to do it is with your AI. These tools are generally too expensive for small to medium retailers. This is unless they have our point-of-sale system as we have incorporated it into our software and issue it free. Using it, you will find it intuitive and straightforward to do. It does not require a lot of training. It is less work than the manual order.

Let's say you have a shelf for toy soldiers. You can not ask for unlimited amounts of toy soldiers. You have to decide how many to carry. So, our users can get a focus order. This is an advanced type of stock control method. It gives you an estimate of what you should order based on the time of year, the product current selling history and suppliers terms.

The AI follows the stock on hand and its business history. It then estimates the stock level required for these goods in the coming period. If it deems that the stock on hand is too low, it will recommend an order to a supplier. This is done with the speed and precision that no one manually can match.


 It is easy to set up and use for details. Please, click here

Data-driven ideas can create value throughout your business. 


Add new comment

Restricted HTML

  • Allowed HTML tags: <a href hreflang> <em> <strong> <cite> <blockquote cite> <code> <ul type> <ol start type> <li> <dl> <dt> <dd> <h2 id> <h3 id> <h4 id> <h5 id> <h6 id>
  • Lines and paragraphs break automatically.
  • Web page addresses and email addresses turn into links automatically.
CAPTCHA This question is for testing whether or not you are a human visitor and to prevent automated spam submissions. Image CAPTCHA
Enter the characters shown in the image.

See how weather influences your product sales

POS SOFTWARE

There are seasonal trends in retail based on weather but just as important are daily weather changes. These cannot often be planned for yet this often determines what we buy, e.g. on rainy days, you can find umbrellas on many shop fronts. Do you think this woman above is going to buy the same products on this day as on a hot day?

If you are not using weather, you missing out on sales opportunities.

So let us start small, and you can build later.

Find some interesting days

So first go here 

Put in the option for weather, your location and note some hot, cold, and wet days. We need a few of each.

Determine how weather affects sales in your shop

Keep an open mind as you may be surprised with different weather conditions, e.g. indoor toys, coffee and glove sales. So what we need is a detailed analysis of historical demand in your shop for these days 

Easy to get it, go to Register reports.

Now pick "Top N Stock Sales for a Given Period."


Now in the form put in a few hot days, instantly a report comes out that looks like this with your top sellers listed for those days.

Take notes of what is unusual.

Now do the same for cold and wet days 

“What if?”: Scenario Planning 

If it's a hot day, what do we want to bring to the front? 
If it's a cold day, what do we get to the front?
If it's a wet day, what do we put to the front?

Now prepare these goods in advance. You may need to do some ordering here.

Most importantly, have some signage ready to bring these goods to the public attention.

Create an Implementation Plan 

When the appropriate day comes, bring some of the goods and the signs to the front. Give them a chance to sell.

You can pick up much business by just looking at the connections caused by weather as it is one of the most critical influences on people.

Add new comment

Restricted HTML

  • Allowed HTML tags: <a href hreflang> <em> <strong> <cite> <blockquote cite> <code> <ul type> <ol start type> <li> <dl> <dt> <dd> <h2 id> <h3 id> <h4 id> <h5 id> <h6 id>
  • Lines and paragraphs break automatically.
  • Web page addresses and email addresses turn into links automatically.
CAPTCHA This question is for testing whether or not you are a human visitor and to prevent automated spam submissions. Image CAPTCHA
Enter the characters shown in the image.

Try this Decoy Price Strategy for Your Business.

POS SOFTWARE

So we have here an item with three sizes, cups of soft drink.

The small cup cost is $4

A large cup cost $8.50

A medium cup costs $8

The positioning is not an accident here as the purpose here is to sell the large cup so we want it in the public mind. 

Now studies show many people will go for the large cup since it is *only 50 cents* more than the medium cup. The only purpose of the medium cup is to boost sales of the large cups. To make this strategy work, you need to be able to offer people three alternatives to similar products. The two cheaper options must be priced lower than the target. The marketing idea is that the target is better value or quality for only a little extra.

For a more detailed example and studies done on this idea, see the Decoy effect in the Wikipedia here.

This strategy is widely used. You can use it for just about anything eg pens, cards, dog food, cosmetics, etc.

Give this idea a go and as always, let me know how it goes.

Add new comment

Restricted HTML

  • Allowed HTML tags: <a href hreflang> <em> <strong> <cite> <blockquote cite> <code> <ul type> <ol start type> <li> <dl> <dt> <dd> <h2 id> <h3 id> <h4 id> <h5 id> <h6 id>
  • Lines and paragraphs break automatically.
  • Web page addresses and email addresses turn into links automatically.
CAPTCHA This question is for testing whether or not you are a human visitor and to prevent automated spam submissions. Image CAPTCHA
Enter the characters shown in the image.

Returns handling in your shop

POS SOFTWARE

Today the number of returns is going up. Much is due to COVID, which has caused many of our clients to update their return policies.  

Unless you have a comprehensive and straightforward return policy, returns can be time-consuming. I say policies because you will find that your return policy has to be different for many goods.

One tip: many majors can transfer much of the cost of the returns to their supplier. See how much you can. What you need to check from your suppliers what their policy is in many situations. Plus be aware that many of your return is not your responsibility but theirs. For example, if you sell an item with a supplier claim, it is not your fault if it is false. 

Also, I do recommend is that you look through the return section of our software. You will find that it makes it quick and easy for you to handle and keep track of the returns.

Add new comment

Restricted HTML

  • Allowed HTML tags: <a href hreflang> <em> <strong> <cite> <blockquote cite> <code> <ul type> <ol start type> <li> <dl> <dt> <dd> <h2 id> <h3 id> <h4 id> <h5 id> <h6 id>
  • Lines and paragraphs break automatically.
  • Web page addresses and email addresses turn into links automatically.
CAPTCHA This question is for testing whether or not you are a human visitor and to prevent automated spam submissions. Image CAPTCHA
Enter the characters shown in the image.

How to make your in demand Products more accessible to customers!

POS SOFTWARE

Now is not the time to keep a “business as usual” approach. COVID-19 has changed the retail scene. Do not count on your experience. You need to look at the data. 

See what items are driving you the most traffic and profits into your shop. Once you know your money-makers, you can move them to prominent places. The current retail theory states that you should put good products in a few places. This is because, in the age of COVID-19, the stress is on giving more space for your high-demand items versus showing many items.

First, let us find your *MONEY EARNERS*. It will only take a second.

Go to register reports and select the top stock report as marked with the red arrow here.


For this do this by all the shop sales. 

Put in the past 30 days, then select 40. This will give you your top 40. 

Then you will get a report with all the figures.

Now put these items in a noticeable place. The more places, the better.

This method works, try it! 

Add new comment

Restricted HTML

  • Allowed HTML tags: <a href hreflang> <em> <strong> <cite> <blockquote cite> <code> <ul type> <ol start type> <li> <dl> <dt> <dd> <h2 id> <h3 id> <h4 id> <h5 id> <h6 id>
  • Lines and paragraphs break automatically.
  • Web page addresses and email addresses turn into links automatically.
CAPTCHA This question is for testing whether or not you are a human visitor and to prevent automated spam submissions. Image CAPTCHA
Enter the characters shown in the image.

Break-Even Analysis

POS SOFTWARE

Today many retailers who are approaching financial institutions are being asked by them to provide estimates. It is not that these institutions are worried about security as most of these loans the government is helping out with that now, what they are concerned with is can you pay the loans?

One of the best tools to reassure these people is the break-even analysis,  something that I have discussed here a lot but now seems to be mentioned a lot more.

The Break-even point, where profits are equal to expenses!


Although because of coronavirus, its all the rage now. It has however widespread use beyond that e.g. how much extra sales do I need to cover a proposed shop fit to make my initial investment back, how much additional sales do I need to pay back the setup and running costs of a loyalty program or how much extra sales do I need to increase my shop hours?

It is an invaluable starting point for finding out where you are at and where you can go. In this case here, is it better for the business to spend its spare money on a shop fit, a loyalty program or to increase its hours?

Here what the financial institutions want to know now is how much business could you lose and still pay your way? 

Now what people often do is give the figures to the accountant and let them do the analysis, which is what these financial institutions want but now they are being very flexible and often will take your figures. 

To calculate a shop's break-even point in you need to know the values of three variables: You can get it out of your profit and loss accounts

Sales turnover: This is simply your turnover (this one is generally easy to get)

Now go through your expenses and put them into these categories.

Fixed costs: These are costs that don’t change whether you sell a few or a lot. These are the costs of just keeping the door of the shop open.

Some examples are 

Rent

Full-time staff

Insurance

Electricity bills 

Bank repayments

Accountant fees

These need to be added up.

Variable costs: These are costs that depend on sales, the more you sell the higher they are:

Part-time staff

Cost of goods sold

Credit card fees

Now, these need to be added up too.

Notes here:

Some of these costs can get programmatic as to which category they are in when there is doubt the rule is to put them in fixed. Generally, unless they are huge, it does not matter much.

Also, often people argue that some of these variable costs change dramatically depending on volume. Well in most situations unless you go pie in the sky, they do not change that much, e.g. you can get a better margin on many items if you sell heaps but are you likely to sell heaps? Like everything, you do need some intelligence to use this analysis.

Now the formula is

Variable profit = (1- (Variable costs)/Turnover)   This gives you your shop profit for each $1 you sell.

Now the Break-even point is (Fixed cost)/(Variable profit)


Say for example you had a turnover of $550,000 

Your Fixed costs are $60,000 a year

Your cost of goods sold is $370,000

Your other variable costs are $40,000

So your variable cost is here is $370,000+n $40,000 = $410,000 

Variable profit = (1- (Variable costs)/Turnover)   This gives you, your Variable profit = (1- (410,000)/550,000) = 0.218

Now the Break-even point is (Fixed cost) /(Variable profit). This gives you your Break-even point as  (60,000)/(.218) = $235,714.29

This would signify that this business is relatively healthy from coronavirus as it can continue with over half the loss of its sales.

Once you get used to doing it, you will find that it typically is like half an hours work.

Now what a lot of retailers would do now is look at their basket reports in their point of sale software, see what a typical basket profit is and divided that into the Break-even point. This determines how many sales they need a day, but that is just the start because there are heaps you can do with it and this will be a subject for a future post.

If there is a lot of interest, I am quite happy to do a webinar on this calculation, so please let me know.


Add new comment

Restricted HTML

  • Allowed HTML tags: <a href hreflang> <em> <strong> <cite> <blockquote cite> <code> <ul type> <ol start type> <li> <dl> <dt> <dd> <h2 id> <h3 id> <h4 id> <h5 id> <h6 id>
  • Lines and paragraphs break automatically.
  • Web page addresses and email addresses turn into links automatically.
CAPTCHA This question is for testing whether or not you are a human visitor and to prevent automated spam submissions. Image CAPTCHA
Enter the characters shown in the image.

Your stock onhand now!

POS SOFTWARE

Now, the stock levels in many shops are a mess. The reality is that the world is moving on and you need your stock right e.g. summer clothes in winter do not sell well. 

This needs to be addressed. 

I suggest that you look at a report that contains the sales of the stock items and the stock on hand figure. Here is one such report, the top N stock report which you can find in register reports here.


Put in the last two months and ten million-selling lines to include everything.

Now you will get a report, that has current sales figures and stock on hand.


Now you need to review these items ASAP


Comments

Add new comment

Restricted HTML

  • Allowed HTML tags: <a href hreflang> <em> <strong> <cite> <blockquote cite> <code> <ul type> <ol start type> <li> <dl> <dt> <dd> <h2 id> <h3 id> <h4 id> <h5 id> <h6 id>
  • Lines and paragraphs break automatically.
  • Web page addresses and email addresses turn into links automatically.
CAPTCHA This question is for testing whether or not you are a human visitor and to prevent automated spam submissions. Image CAPTCHA
Enter the characters shown in the image.

Different types of margins

POS SOFTWARE

Margins are often considered as being the most important KPI in stock control.


Like everything, it gets more complicated once you get into it as different shops tend to have different needs and requirements. So we have a few different types of margins, actually, and it is helpful to run through them.

Gross profit margin

This is the difference between profit before expenses such as salaries, rent, advertising etc., you earned and the cost of goods sold, generally expressed as a percentage of revenue.

= 1 - (cost of the wholesale price) /(revenue) 

for example, you buy the goods for $35, you sell them for $60, so it becomes

1- 35/60 = .42 

Which as expressed as a percentage: 0.42 * 100 = 42%.
This is how you calculate the gross profit margin

Your suppliers can give you this figure, and I strongly suggest that you ask for the gross profit margin, not the markup, which some suppliers will provide you as it inflates their profit figure.

Actual margins

Is the actual margin with discounts included that you are getting? In the real world, often, what we sell is not what the supplier recommended prices are, and as I discussed already here, click here for more details.

Net profit margin

Is much harder to determine and involves you putting into the costs such items as salaries, rent, advertising etc., into the costs. The problem a point of sale software has is that much of this information is unavailable. Your accountant should be able to give you an approximate figure which will be in the form of

Your cost for the shop = factor x (cost of wholesale goods) + (fixed fee)

As the fixed fee is minimal for each item sold, most people multiply the cost of wholesale goods by the factor. So say the accountant said the factor is 18%, the  actual margin is, for example, 35% for the item above, then your net profit margin for this item is 35%-18% = 17%

This is an instrumental figure to keep in the back of your head, as if you know an item has a margin of 15%, then if your is 18% which is often what it is in retail, you are losing money on that item. Note, of course, if you have lotto, you may need a few factors.

There is, of course, no definite answer to what is a good margin. It depends on your business, so I suggest you check with your respective industry and the ATO benchmarking for an idea of what margins you should be getting. 

Add new comment

Restricted HTML

  • Allowed HTML tags: <a href hreflang> <em> <strong> <cite> <blockquote cite> <code> <ul type> <ol start type> <li> <dl> <dt> <dd> <h2 id> <h3 id> <h4 id> <h5 id> <h6 id>
  • Lines and paragraphs break automatically.
  • Web page addresses and email addresses turn into links automatically.
CAPTCHA This question is for testing whether or not you are a human visitor and to prevent automated spam submissions. Image CAPTCHA
Enter the characters shown in the image.

More data = more accuracy

POS SOFTWARE

We are the only point of sale system. I know that has data mining so our users are lucky that can drive through their tons of data unaided for free. 

With margins so low now in retail, you need every help you can get to gain those few extra percentage points that make or break a business. 

Today business is about data and analysing.

Here is one example, SMB has a significant problem with setting up sales targets that are reasonable as who has time to go through every stock item and make a sales budget. Yet if these sales budgets are:

1) If they are too high soon, no one pays attention to them

2) If they are too low, then its no challenge, what people tend to do here is once they make the budget to stop.

What can help drive sales are targets that are challenging and believable?

Well, our clients have an automatic system that can do that now. It is the focus number. It will give you a reasonably good idea of what sort of movement you can expect from every item in your shop. It is a weekly budget.

Here is how you set it up.

It is easy to set up, and use for details click here.

With capable software, you can assess your stock sales better. You can see what you did right and what you did wrong this week.

For details on how to do this, please, click here.


Add new comment

Restricted HTML

  • Allowed HTML tags: <a href hreflang> <em> <strong> <cite> <blockquote cite> <code> <ul type> <ol start type> <li> <dl> <dt> <dd> <h2 id> <h3 id> <h4 id> <h5 id> <h6 id>
  • Lines and paragraphs break automatically.
  • Web page addresses and email addresses turn into links automatically.
CAPTCHA This question is for testing whether or not you are a human visitor and to prevent automated spam submissions. Image CAPTCHA
Enter the characters shown in the image.

Market researching products to sell

POS SOFTWARE

Your POS System can tell you what has sold well in a department and it will tell you what has sold well with another product. This is all good stuff for upselling. The problem is that you are looking at is what was in your store, which is only a tiny subset of the products available plus it is only telling you what *WAS*. What you need to know is what is *NOW* and what will *BE*!

Here is a tip to help you to do this which you can do.

In Amazon Australia, you will find the best seller's list here

Now pick a department say "Pet Supplies" and out will pop all the top sellers here 

These are the top-selling items updated hourly, so it is current information.  

Now go through the items and see which ones appeal to you. You will see the sales ranking. If you click on the items, you will see a lot of details, including what people think about these items.

I am sure it will give you a lot to think about them.

The best part about it is these are local products.

Now if you wanted to see what people in the US were buying, after all, they are not that different to Australian consumers, you can check the US website here

Be careful as although many think, that the US market is more advanced than ours. I am no so sure of this in my experience. It is an odd combination of being more advanced and more behind us plus it's a different market with different costs, benefits and requirements so be cautious about using it. Still because of its Winter/Summer being reversed there many of you will get many goods ideas of where the market is moving.


Add new comment

Restricted HTML

  • Allowed HTML tags: <a href hreflang> <em> <strong> <cite> <blockquote cite> <code> <ul type> <ol start type> <li> <dl> <dt> <dd> <h2 id> <h3 id> <h4 id> <h5 id> <h6 id>
  • Lines and paragraphs break automatically.
  • Web page addresses and email addresses turn into links automatically.
CAPTCHA This question is for testing whether or not you are a human visitor and to prevent automated spam submissions. Image CAPTCHA
Enter the characters shown in the image.

Impulse marketing

POS SOFTWARE

I was reading an article in better retailing here. It certainly gave me something to think. Pepsi has a Head of Impulse category, and he explained how the PepsiCo system works and that in one trial it increased sales by 17%.

Well, it is straightforward to do with our system, will not take you very long to set up, and if it works why not try it?

And its easy in our point-of-sale system to do it.

Go to Register reports.


Now select "Top N Stock Sales for a Given Period."


You will want about 40 items with say the last three months of sales so on our listing which will look like this.


Checked that the top 40 items are right in the front with good facing, so they are noticeable by the public.  

Give it a shot and see how you go. 

If it works, I would suggest going over each department and making sure that the top 40 of each department are with good facing. 
 

Add new comment

Restricted HTML

  • Allowed HTML tags: <a href hreflang> <em> <strong> <cite> <blockquote cite> <code> <ul type> <ol start type> <li> <dl> <dt> <dd> <h2 id> <h3 id> <h4 id> <h5 id> <h6 id>
  • Lines and paragraphs break automatically.
  • Web page addresses and email addresses turn into links automatically.
CAPTCHA This question is for testing whether or not you are a human visitor and to prevent automated spam submissions. Image CAPTCHA
Enter the characters shown in the image.

Margin on eCommerce

POS SOFTWARE

I attended yesterday, the New Retail ’19 which is Australia’s largest retail gathering. It brought together over 2500 retail leaders and learners for a three immersive day to explore omnichannel retail, fulfilment strategy and partnerships. Some of the stuff was an eye-opener, and it is going to take me a while to digest much of it. 

New Retail 19

The first point I wish to discuss is the margins required for e-commerce with some real data supplied at the show. I will explain it point by point to give you a professional appreciation of how these people think plus give you a feel of how it works and what sort of product you require.

What happened was a company decided to advertise a product using keywords in Google advertising. These are the advertisements that you see on the top, left and bottom of the screen when you look up something up in google. So they put in an advertisement into Google. This is the result


  Raw figures Calculated figures
Metric     
Impressions 2,165,947  
Clicks 161,756  
Click through rate (CTR)      7.47%
Cost per click (CPC) $0.35  
Marketing costs   $56,752.24 
Orders 4,303  
Revenue $295,322.70  
Effective revenue share (ERS)     19.17%


The raw figures are the ones that they put in, and the calculated values are the ones that they derived.

Impressions: This is the number of times that the advertisement was shown.  In this case, it was shown over 2 million times.

Clicks: Is the number of times that someone went to the advertisement. 

Click through rate (CTR): Is the percentage of how many times the advertisement is clicked compare to how many times it is shown. This is very important as if this is low then Google shows your advertisement less so even if you are prepared to pay Google will not show it. What Google says is that your advertisement is less relevant to their users' requests so they will give their users more relevant information. 

Cost per click (CPC): Is how much this person paid every time someone clicked the advertisement.  

Marketing costs: Is the amount that was paid for the advertisement.

Orders: This is the number of orders the company got 

Revenue: This is how much the orders added up to, I am not sure if this includes shipping costs and other products that were sold by them.

Effective revenue share (ERS): This is the line I wanted to get too. What this is, is the cost of the advertising to revenue. In this case, it was 19.17%. 

The point here is that this particular item, putting aside all other costs requires 19.17% of the revenue to pay for the Google advertisement, that does not include many other costs, e.g. website, storage, etc. You need to pick your product.


Add new comment

Restricted HTML

  • Allowed HTML tags: <a href hreflang> <em> <strong> <cite> <blockquote cite> <code> <ul type> <ol start type> <li> <dl> <dt> <dd> <h2 id> <h3 id> <h4 id> <h5 id> <h6 id>
  • Lines and paragraphs break automatically.
  • Web page addresses and email addresses turn into links automatically.
CAPTCHA This question is for testing whether or not you are a human visitor and to prevent automated spam submissions. Image CAPTCHA
Enter the characters shown in the image.

Sales targets that are challenging and believable

POS SOFTWARE

A major problem with setting up sales targets is that 

1) If they are too high soon, no one pays attention

2) If they are too low, then its no challenge, what people tend to do here is once they make the budget to stop.

What you need are sales targets that are challenging and believable?

Well, our clients have an automatic system that can do that now. It is the focus number. It will give you a reasonably good idea of what sort of movement you can expect from every item in your shop. It is a weekly budget.

Here is how you set it up.


It is easy to set up, and use for details click here.

With effective software, you can assess your stock sales better. You can see what you did right and what you did wrong this week.

For details on how to do this, please, click here


Add new comment

Restricted HTML

  • Allowed HTML tags: <a href hreflang> <em> <strong> <cite> <blockquote cite> <code> <ul type> <ol start type> <li> <dl> <dt> <dd> <h2 id> <h3 id> <h4 id> <h5 id> <h6 id>
  • Lines and paragraphs break automatically.
  • Web page addresses and email addresses turn into links automatically.
CAPTCHA This question is for testing whether or not you are a human visitor and to prevent automated spam submissions. Image CAPTCHA
Enter the characters shown in the image.

The years 10 busiest shopping days are here

POS SOFTWARE

Studies in the US  which I believe are valid here show that 45% of all shopping traffic in bricks-and-mortar shops in the Christmas season occurs on the following ten days. 

  1. Friday, November 23 – Black Friday (Today - Less important then in the US but rapidly growing)
  2. Saturday, November 24
  3. Saturday, December 1
  4. Saturday, December 8
  5. Saturday, December 15
  6. Friday, December 21
  7. Saturday, December 22 – Super Saturday
  8. Sunday, December 23
  9. Wednesday, December 26
  10. Saturday, December 29

Peak shopper times are between 2:00 p.m. and 4:00 p.m.


Looking at the list, it seems like a lot of Saturday work coming up.

These days are the ones that you need to plan and have your rosters, stock and signage right.

Warning

It is also a good idea to have someone special doing security on those days too; I am a great believer in the theory that much of the security problems in retail can be solved by having grandmother greet everyone personally that comes into the shop.


Add new comment

Restricted HTML

  • Allowed HTML tags: <a href hreflang> <em> <strong> <cite> <blockquote cite> <code> <ul type> <ol start type> <li> <dl> <dt> <dd> <h2 id> <h3 id> <h4 id> <h5 id> <h6 id>
  • Lines and paragraphs break automatically.
  • Web page addresses and email addresses turn into links automatically.
CAPTCHA This question is for testing whether or not you are a human visitor and to prevent automated spam submissions. Image CAPTCHA
Enter the characters shown in the image.

Stock Performance Reporting by supplier

POS SOFTWARE

It is said that "The devil is in the detail."

In retail, its the item that sells not the category or the department! 

A supplier rep is coming to see you, no doubt they are a friendly person. They have been briefed, they have an excellent overview of the market for their product, the odds are they know how their stock is moving in your store better then you do and they know your shops potential for their product better than you but they also have an agenda to get you to sell more of their product.

So what you need to be is briefed too and with a point of sale software, you can and should be able to look at this supplier's range in your shop and see exactly to the item level what is selling. How fast their items are selling? Which items are making the money?  So you can determine which of their items are worth investing.

Your stock performance report helps to answer such questions. 

What I will do here is take you through a review on one such report and what you can learn from this report.

Go to register reports>Suppliers>Suppliers sales trend, see the arrow in green


Supplier sales trend menu

There are the ad-hoc, excel and OpenOffice import which please ignore for the time being although I do suggest later using it to produce summary reports.

Now the options, I picked are here.

Supplier trend options

I picked an arbitrary supplier FAS. Again ignore the extra options for now and press view report. 

Supplier sales trend report

Here’s how it goes:

Look at the arrow in red, you have 19 of this item now, but you never sell any of these items. It is a worry.

Conversely look at the item in blue, you have none in the shop, and you have sold heaps of these items, what gives here?

Now in green what you will see is that one of the stock items is in negative. This is not a good sign as it shows your stock quantities are not entirely right. 

It all comes down to this

By looking at these items in detail, you can see which items are selling well. You can bring up this with the rep as you now have a clearer idea of what you need and what to order. 


Add new comment

Restricted HTML

  • Allowed HTML tags: <a href hreflang> <em> <strong> <cite> <blockquote cite> <code> <ul type> <ol start type> <li> <dl> <dt> <dd> <h2 id> <h3 id> <h4 id> <h5 id> <h6 id>
  • Lines and paragraphs break automatically.
  • Web page addresses and email addresses turn into links automatically.
CAPTCHA This question is for testing whether or not you are a human visitor and to prevent automated spam submissions. Image CAPTCHA
Enter the characters shown in the image.

Make an event - marketing tip

POS SOFTWARE

Cosmopolitan magazine

I was stunned when I was informed today that Bauer Media is cutting Cosmopolitan Australia in December, as commercially it is no longer viable. In the process another eleven jobs have are gone, and another restructuring and centralisation are underway.

This magazine was an icon, and many will have many good memories of this product so why not make an event if you sell a product like this to get people to come into the store for an impulsive purchase of the last couple of editions.  While supplies last, the final edition, get your copy... collector's item (which I am sure it will be) ... 

Maybe when they come into the shop to buy this product, they will buy more too? All you need to try it is a small sign on the window to make an event.


Add new comment

Restricted HTML

  • Allowed HTML tags: <a href hreflang> <em> <strong> <cite> <blockquote cite> <code> <ul type> <ol start type> <li> <dl> <dt> <dd> <h2 id> <h3 id> <h4 id> <h5 id> <h6 id>
  • Lines and paragraphs break automatically.
  • Web page addresses and email addresses turn into links automatically.
CAPTCHA This question is for testing whether or not you are a human visitor and to prevent automated spam submissions. Image CAPTCHA
Enter the characters shown in the image.

Stock know your 1%

POS SOFTWARE

There is a rule that seems to show up all the time that 1% of the population participate, 9% occasionally participate and the other 90%  do nothing. It is called the 1% rule although a lot of people call it the 90/10 rule. 

We see something like this is stock.

Here is a graph of a reasonable size shop with sales in order of the top selling items to the worst selling items based on retail turnover.

Top selling stock lines in ranking order

The shop sold in a year exactly 20,060 different stock lines.

Here are some figures, slightly less then 1% actually the top 220 stock lines did 50% of shop sales. But it does down further out of the top 220 stock lines, the top 10 stock lines did about 33% of the shop sales and the top two lines did just over 15% of the shops' trade.

When I first saw this, it hit me like a brick

I think you would have to admit that this is quite amazing. Now what the retailer should do is concentrate most of there efforts on the items that are really making the money.

Now let us find your top 1% stock lines.

Go to register reports and select the top stock report as marked with the red arrow here

You will get this screen

Now select your criteria, note there is also a tab called "More Criteria" which has more options plus the traffic (which is people in the shop) option but we will discuss that later.

I do suggest that you do this by overall shop sales and then research in depth for each department.

Here I used the stationery department. In red, I put in 32000 to make sure I get everything and as I like to get a long-term view, I selected a whole year as small periods can have major fluctuations.

Then you will get a report with all the figures.

It’s that simple

It can be done in less than a minute.

Add new comment

Restricted HTML

  • Allowed HTML tags: <a href hreflang> <em> <strong> <cite> <blockquote cite> <code> <ul type> <ol start type> <li> <dl> <dt> <dd> <h2 id> <h3 id> <h4 id> <h5 id> <h6 id>
  • Lines and paragraphs break automatically.
  • Web page addresses and email addresses turn into links automatically.
CAPTCHA This question is for testing whether or not you are a human visitor and to prevent automated spam submissions. Image CAPTCHA
Enter the characters shown in the image.