
This is said to be the most important KPI in stock control.
What it measures is how much did you actually make on an item? It is a difficult question to know by gut feel particularly when you have thousands of items that you handle.
This is what the chart looks like in theory.
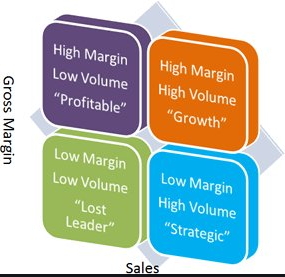
In practice, it is more complex because this chart assumes that you are conscious of what category an item is in. Too often a Low Margin/Low volume item should not be in the shop and is an accident. Also, it is very hard to assess which item is better a High Margin/Low volume item or a Low Margin/High volume item. Also as stock comes and goes, prices and margins change all the time it is very hard to determine by gut feel what is working and what is not.
This is what Gross Margin Return (GMROI) is designed to help you determine. What it does is measure your actual stock items and gives you a financial return figure on your stock? Generally, it is measured in a department or by supplier although I have seen it used for every item in the shop. What it does is tell you where you should look in your shop to get the best return on your orders.
Here is how it is calculated manually which will give you a feel of what it does.
Step #1: Gross Margin in Dollars= Sales x Margin%
So say you sold $1000 last year of an item, your margin was 30%, so your profit is $300.
Step #2: Average stock holding = ((Stock at start of the year) + (Stock at the end of the year))/2
You started the year with $1600 of stock and ended the year with $100 so your Average stock holding = (1600+100)/2 = $850.
Step #3: GMROI = (Gross Margin in Dollars )/(Average stock holding)
GMROI = ($300)/($850) = 0.35
What it tells you is that for every dollar you have invested in stock, you are getting a dollar back to pay all your expenses and buy new stock.
What it tells you is that for every dollar, you invested in that item, you made 35 cents. Of course, no one can maintain a business at that level; I just made a simple example to explain the concept.
If you notice, the calculation itself is almost manually impossible to do for each item. Here are some immediate problem points, items often do not have a steady margin; the 30% is often an ideal that a supplier provides and my stock holding obviously, here varied a lot during the year. Say, for example, my Margin was closer to 25%, so I made $250 and my average stock holding over the year was $100,
My GMROI = ($250)/($100) = 2.5, so I made for every dollar on that item $2.5
The computer can overcome these problems with GMROI
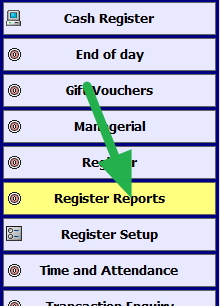
Go to register reports
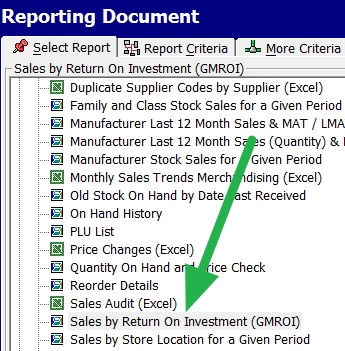
Select GMROI marked in green
Now select the date you require. I suggest looking at last year, mainly as it is now the time we are looking back.
I selected in this shop confectionery.
Out pops a report that looks like this among other items.
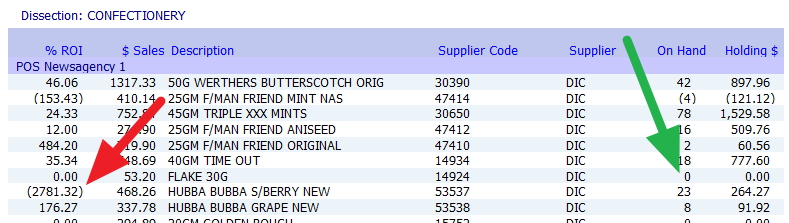
Now in green, the On-Hand figure is zero; the stock ran out, that would be definitely one to look at what happened there and the one marked in red; it has a negative result; this is almost certainly due to data errors which I will discuss in another post.
As these two items show, to get any use from GMROI you need to export the data into excel or OpenOffice (OpenOffice is free and well worth getting if you do not have excel) where you can edit and remove if necessary bad data.
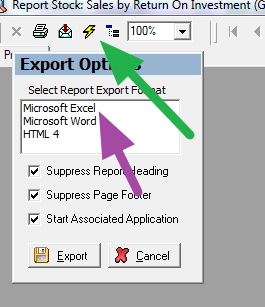
So on the top left-hand side, click export (where the green arrow is), and click excel where it's marked in purple.
Now you have a list to review and edit. That is why it must in my view be in excel otherwise you cannot really do GMROI.
High turnover, high GM% and low stock holding are perfect while low turnover, low GM% and high stock holding are terrible.
However high number does not necessarily indicate that all is good, it often means you are under ordering and do not have enough stock, although sometimes it means that the item does really well only very few people come into your shop to get it. So you are not going to sell much more if you bring in more stock. Maybe look at add on sales for that item instead. Low numbers tend to indicate that you are over-ordering.
Only you know the retail dynamics of your shop and it can help and a detailed system of stock control like ours can keep the customer satisfied and you in business.

