
Suddenly yesterday, a few people asked me how to get each item's actual stock sales over the last 12 months.
What they want to see is how many items they moved each month in a department. To do this, you need two years of history. So although we have a report that shows 12 months, I showed them the 24-month sales history report. This is because of what required when looking at sales is to see what you sold last year about this time. For example, Easter is coming up. Say you sell Easter items. With the previous 12 months, you will miss all the sales leading up to Easter for these items. That is why large suppliers often work with figures for the last two years. They then tend to quote you such statistics as this time last year, you sold ......
Plus if you are looking at Easter, you may want to look by a selected supplier with these Easter items or a selected range of items marked for Easter. So you rarely need the whole department, as it is too big.
Well, it is all easy to do and will take you a second to find out.
To get started, go to Register Reports > Sales Stock > Stock Sales Details 24 Month Trend.
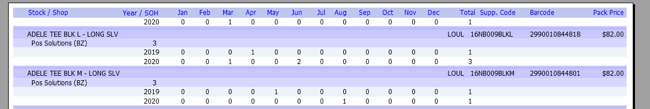
Now put in the criteria you want, and you will see the above report.
You get a lot of detail, the stock on hand figure, two years of history, the total sales, etc.
This report can help you to get helpful insights into the stock that you sell.

